filmov
tv
ggside: Plot Linear Regression using Marginal Distributions (ggplot2 extension)

Показать описание
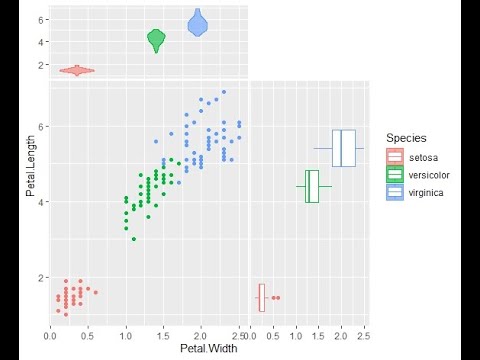
Marginal Distribution (Density) plots are a way to extend your numeric data with side plots that highlight the density (histogram or boxplots work too).
Marginal Distribution Plots were made popular with the seaborn jointplot() in Python. They can now be made in R using #ggside, an new #ggplot2 extension! You can make linear regression with marginal distributions using histograms, densities, box plots, and more.
Bonus - The side panels are super customizable for uncovering complex relationships.
GET THE CODE SHOWN IN THE VIDEO:
Are you ready to get a job, make a data science transition, and accelerate your career? Then read on!
MY COURSES WILL SKYROCKET 🚀 YOUR CAREER IN WEEKS:
TABLE OF CONTENTS
00:00 Introduction to ggside
00:25 GitHub Project Setup
01:13 Libraries: ggside, tidyverse, tidyquant
01:42 Data - mpg dataset
02:13 Plot 1 - Side-Density Plot with Scatterplot Main
06:26 Plot 2 - Faceted Main Plot with Side-Boxplot
 0:08:54
ggside: Plot Linear Regression using Marginal Distributions (ggplot2 extension)
 0:06:48
#R | ggside package ...UPGRADE Visualization | #ggside #DataVisualization #RPackage
 0:10:01
How to plot Informative beautiful plots in R: Marginal plots using ggExtra and aplot packages
 1:34:50
Data visualization using ggplot2 and its extensions
 1:01:23
StatPREP Webinar: Visualization with RStudio using ggplot 2
 0:05:52
DATA VISUALIZATION IN R - Marginal Histograms in ggplot
 0:11:08
Adding Marginal Density Plots to a Graph in R
 0:08:04
easystats: Quickly investigate model performance
 0:07:50
corrmorrant: better correlation plots with ggplot2
 0:05:52
R | ggside (gráficos combinados, distribuciones marginales)
 0:12:26
R 3-5 ggplot2 Faceting, Themes, & More
 0:09:29
patchwork: The ggplot2 plot combiner
 0:06:52
grafify: Make great-looking ggplot2 graphs quickly with R
 0:31:38
ST308 - Graphical Summaries of Quantitative Variables with ggplot2
 0:06:18
ggalt: Dumbbell Plot to Show Change Between Two Points with ggplot2
 0:08:25
Marginal plots using ggExtra: Advanced ggplot2 Show raw data with its distribution
 0:04:51
Add Marginal Plot to ggplot2 Scatterplot Using ggExtra Package in R (Example) | ggMarginal Function
 0:00:26
Interactive Plots - pivotpy - plotly
 0:09:29
Intro to base-R and ggplot graphics
 0:10:19
Plotting Time Series in R (Bonus: Cyberpunk ggplot theme)
 0:08:07
ggdist: Make a Raincloud Plot to Visualize Distribution in ggplot2
 0:00:33
Visualisasi data panel menggunakan packages ggplot2 dan plotly pada R
 0:03:46
R ggThemeAssist
 0:07:31
ggforce: Visualizing clusters using Hull Plots in ggplot2
Комментарии