filmov
tv
Timelapse decreasing Arctic Sea Ice Extent 1979-2024

Показать описание
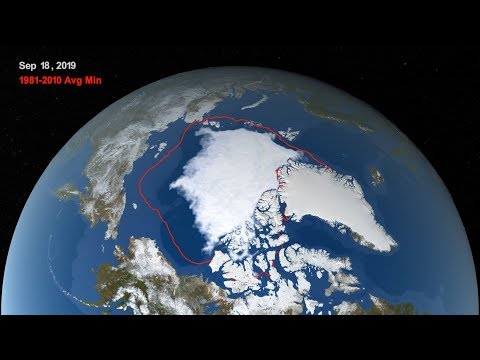
The sea ice area for the Arctic shows near-record minimums since 2002. The timelapses show the areas for each month relative to the median extent (purple line). The median extent is based on the period 1981-2010. The recent years represent a unique event because they show a year-to-year persistence of minimum ice extents. Sea ice area is now significantly below the level of the 1980s and earlier.
There are two timelapses in the video. One is sequential in time with the end of the month as a the image included. It shows very well the natural flow in ice extent on the Northern Hemisphere.
The Second one shows from 1979 till 2024 every month. You can compare for yourself how every end of the month differs.
All images come from the NOAA and are public domain.
 0:03:30
Disappearing Arctic sea ice
 0:00:55
Arctic Sea Ice Melting Over the Years | 2000-2022 Time-lapse
 0:00:16
Arctic sea ice decline timelapse
 0:03:47
Timelapse decreasing Arctic Sea Ice Extent 1979-2024
 0:01:09
Arctic Sea-Ice Continues To Thin | 3-Year Time-Lapse
 0:00:47
Annual Arctic Sea Ice Minimum Area 1979-2022, With Graph
 0:02:30
Perennial Arctic Sea Ice Decline 1984 – 2016 (4K)
 0:02:36
NASA Releases Time-Lapse Of the Disappearing Arctic Polar Ice Cap
 0:01:14
Arctic Sea Ice Timelapse (2005-2008) [1080p]
 0:02:34
Annual Arctic Sea Ice Minimum 1979-2016 (4K)
 0:00:34
Clouds Over Cracks in Arctic Sea Ice Show Mercury Pumping
 0:00:43
September Arctic Sea Ice Extent 1979 to 2021
 0:00:39
Watch Arctic sea ice shrink
 0:00:23
Watch 26 Years of Arctic Ice Disappear in Seconds
 0:00:42
Multi-year Arctic Sea Ice
 0:00:31
Arctic Sea Ice Spiral
 0:01:05
2019 Arctic Sea Ice Maximum Continues Trend of Decline
 0:02:06
Arctic Sea Ice Melting (1984 - 2020) | Timelapse Video
 0:00:44
September Arctic Sea Ice Extent 1979 to 2022
 0:01:11
NASA Releases Time-Lapse Video Of Depleting Arctic Ice Cap | BOOM
 0:03:23
Arctic sea ice continues a trend of shrinking maximum extents
 0:00:42
Animation of September Arctic Ice Extent 1979 to 2020
 0:02:33
Arctic Sea Ice Reaches 2019 Minimum Extent
 0:15:09
NASA Released A Time-Lapse Of The Arctic Ice Cap Melting – And The Reality Is Seriously Distressing...
Комментарии