filmov
tv
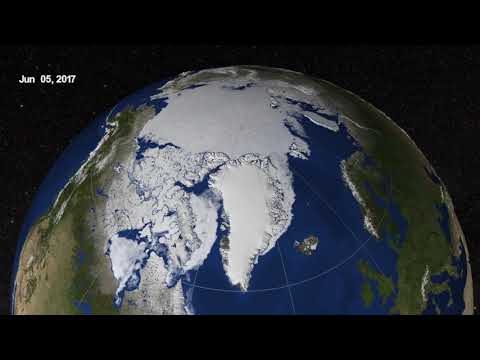
Annual Arctic Sea Ice Minimum 1979-2016 (4K)

Показать описание
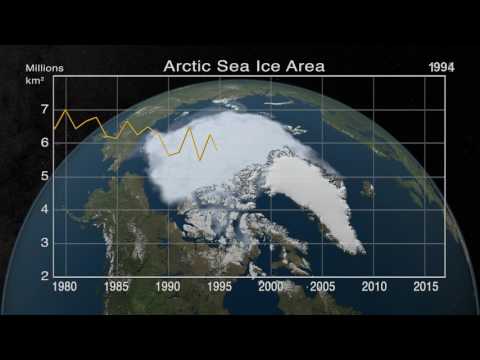
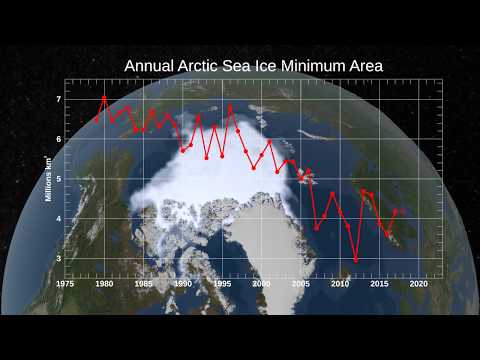
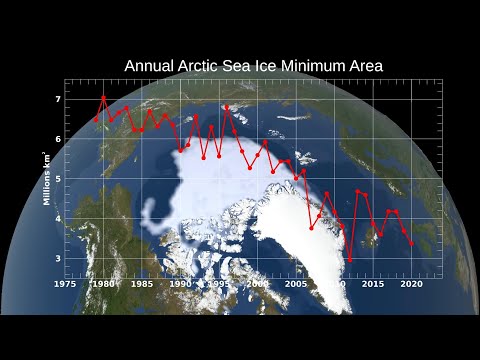
Since 1979, satellites continuously monitor changes in the Arctic ice. The animation displays the area of the minimum Arctic Sea Ice coverage each year from 1979 through 2016. The Arctic ice cap melts down every summer to what scientists call its "minimum", before colder weather begins to cause ice cover to increase.
Credit:
NASA/Goddard Space Flight Center Scientific Visualization Studio
Credit:
NASA/Goddard Space Flight Center Scientific Visualization Studio
 0:00:47
Annual Arctic Sea Ice Minimum Area 1979-2022, With Graph
 0:02:34
Annual Arctic Sea Ice Minimum 1979-2016 (4K)
 0:00:43
Annual Arctic Sea Ice Minimum 1979-2015 with Area Graph
 0:00:22
Annual Arctic Sea Ice Minimum 1979-2016 with Area Graph
 0:00:41
Annual Arctic Sea Ice Minimum 1979-2019 with Area Graph
 0:00:47
Annual Arctic Sea Ice Minimum Area 1979-2022, With Graph
 0:01:37
Arctic Sea Ice Maximum 2023
 0:01:03
Arctic Sea Ice Minimum 2016
 0:00:45
Annual Arctic Sea Ice Minimum 1979-2020 with Area Graph
 0:00:47
Annual Arctic Sea Ice Minimum Area 1979-2023, With Graph
 0:01:19
Arctic sea ice minimum 2017
 0:00:13
Arctic Sea Ice Age at Yearly Minimum (Years 1984-2022)
 0:00:23
Arctic Sea Ice Age at Yearly Minimum (Years 1984-2021)
 0:01:41
Arctic Sea Ice Hits Annual Minimum, Antarctic Sets New Record
 0:00:27
2013 Arctic Sea Ice Minimum
 0:00:48
Annual Arctic Sea Ice Minimum 1979-2021 with Area Graph
 0:00:41
Annual Arctic sea ice minimum 1979-2018 with area graph
 0:01:31
Arctic Sea Ice Minimum 2023
 0:01:39
Arctic Sea Ice Hits 2023 Maximum
 0:00:22
Approaching the 2015 Arctic Sea Ice Minimum
 0:00:24
Annual Arctic sea ice minimum 1979-2016 with area graph
 0:02:02
Arctic Sea Ice Minimum 2018
 0:00:22
Annual Arctic Sea Ice Minimum 1979-2016 with Area Graph
 0:00:17
Arctic Sea Ice from March to September 2017
Комментарии