filmov
tv
Create your Business Grafana dashboard | Step by step for analysts | Grafana Tutorial

Показать описание
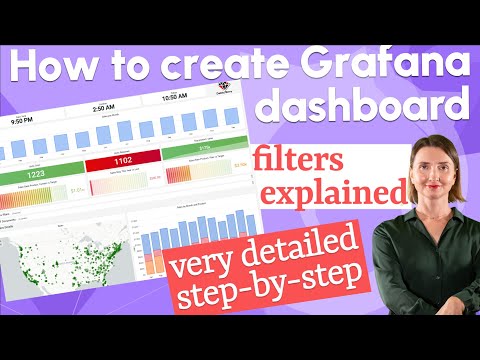
As promised in my previous video, this one is about creating your first Grafana dashboard with detailed step-by-step instructions for many Grafana panels, such as bar chart, bar gauge, single stat, base64, pdf, and Geomap.
There are many more visualizations available and more videos to come about them. Let me know what visualization or plugin you want me to review next. Here I also show how to connect to the PostgreSQL data source.
CHAPTERS
0:00 Intro
0:12 Prerequisites
0:43 The final product with quick elements walkthrough
2:15 Why adding a data source should be your first step
2:31 How to add a data source
3:03 PostgreSQL docker container data source setup
3:45 How to start a dashboard creation
4:17 Bar chart
6:41 Bar gauge
8:40 Duplicate a bar gauge
8:57 Single stat
10:00 Base64 PDF
10:20 Where is the Grafana marketplace
11:03 Grafana row
11:22 Geomap
11:56 Clock
12:23 Image/Logo
12:44 How to setup filters/variables
13:40 How to use filters/variables in the visualizations
14:03 Dark to Light
DISCOVER
GET IN TOUCH
#Grafana #GrafanaPlugins #Visualization #Business #visualización #Negocio
Комментарии
 0:14:44
 0:16:02
 0:01:05
 0:22:24
 0:36:24
 0:04:32
 0:21:00
 0:08:42
 0:01:25
 0:22:14
 0:13:51
 0:07:17
 0:13:54
 0:09:53
 0:25:28
 0:27:21
 0:13:42
 0:03:58
 0:24:36
 0:00:34
 0:20:07
 0:30:19
 0:06:37
 0:05:15