filmov
tv
Build directed graph in Grafana using Apache ECharts | Tutorial part 1

Показать описание
Data visualizations can and should be done in style.
I aim to explain everything step-by-step to ensure many more people can get creative and let their imaginations run wild, knowing that everything dreamed of can lend to the analytics dashboard.
LINKS FROM THE VIDEO
CHAPTERS
0:00 Intro
0:39 Who I am
1:09 Demo of the completed directional graph
4:04 Requirements - what was the initial goal?
6:10 Data structure
7:42 Javascript data structure
10:07 ‘Option’ is the key in Apache ECharts
10:25 Where to learn more about ‘option’
11:08 Changing the symbol for the Line chart
11:53 Apache ECharts graph basics
DISCOVER
GET IN TOUCH
#Grafana #GrafanaPlugins #Visualization #Graph #ECharts #visualización #cuadro
Build directed graph in Grafana using Apache ECharts | Tutorial part 1
Build directed graph in Grafana using Apache ECharts | Tutorial part 2
Render a directed graph using Apache ECharts in Grafana | Graph customization
Beginners guide - Visualizing Node Graphs | Grafana
Apache ECharts panel for Grafana | How to create modern dashboards in Grafana | ECharts Tutorial
grafana - Flowcharting - bug
Visualize K8s inbound connections with Grafana node graph
Make a HTTP/2 service map using Grafana's node graph
Visualize K8s outbound connections with Grafana node graph
DENOG13 What's new in Grafana?
D3.js in 100 Seconds
Node-Link Graph
Grafana Flow
Tracing made simple with Grafana
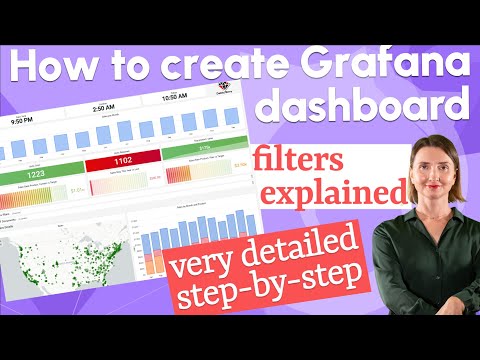
Create your Business Grafana dashboard | Step by step for analysts | Grafana Tutorial
Using Bonobo, Airflow and Grafana to visualize your business
Grafana 10.1: Introducing the geomap network layer
DataGraph PowerBI + Qlik Sense + Grafana
Use Data Source in Apache ECharts in 90 seconds | Grafana Data attribute
SVG in Grafana
Apache Cassandra Lunch #62: Grafana Dashboard for Apache Cassandra
Monitor Apache Airflow with StatsD | Prometheus | Grafana | part2
Magic JavaScript trio for Grafana | Dynamic Text, Data Manipulation and Apache ECharts plugins
Dynamic Text Plugin for Grafana | Markdown, HTML and Handlebars to transform data visualizations
Комментарии
 0:15:27
 0:15:39
 0:01:38
 0:05:07
 0:10:19
 0:03:42
 0:02:59
 0:03:12
 0:02:49
 0:10:44
 0:02:20
 0:00:32
 0:00:50
 0:55:16
 0:14:44
 0:45:21
 0:01:24
 0:01:07
 0:02:00
 0:00:42
 0:56:22
 0:16:21
 0:07:08
 0:08:02