filmov
tv
Advanced Excel Tips: How to Create a Dynamic PivotTable Style Report with One Formula
Показать описание
Advanced Excel Tips: How to Create a Dynamic PivotTable Style Report with One Formula | Excel University
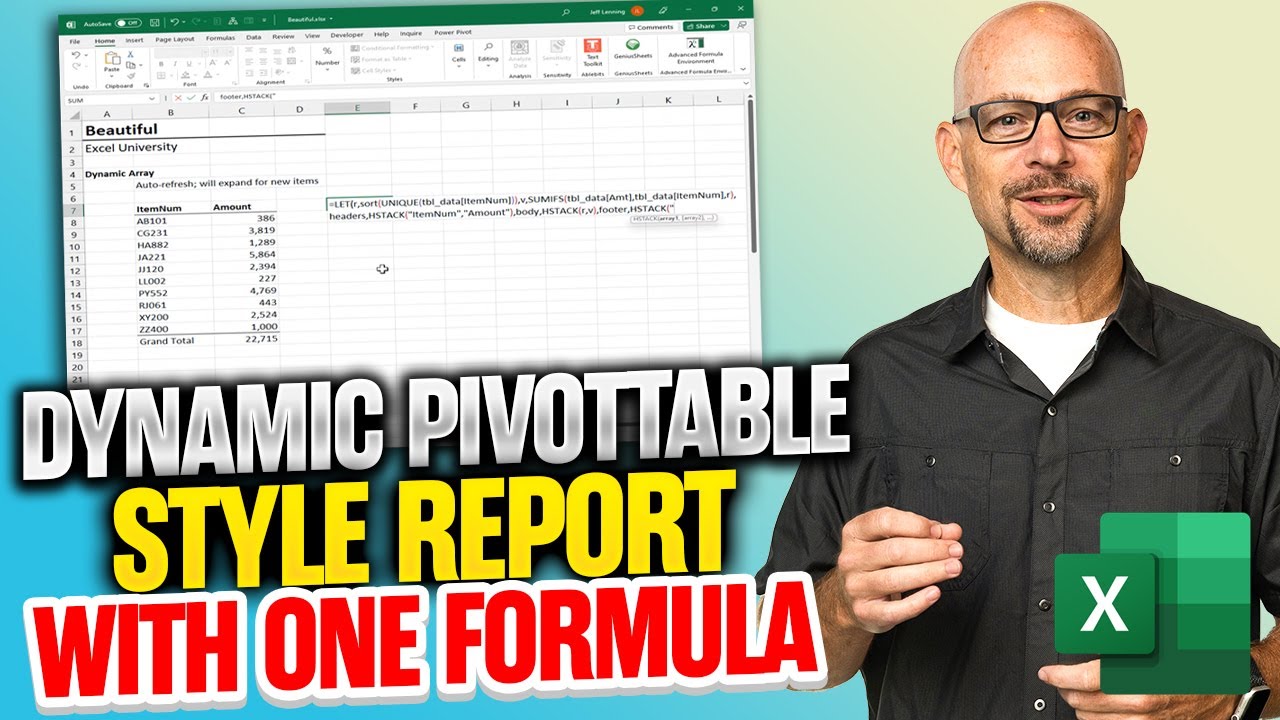
Historically, we've had two basic ways to create reports in Excel. We could use formulas to compute the report values or we could use a PivotTable. Both options had pros and cons, and we'd have to pick the type of report based on the context of our workbook. In this video, I'll show you a new option that provides the pros of both options and the cons of neither. It uses the new VSTACK and HSTACK functions to create a dynamic PivotTable-style report with a single formula that auto-refreshes values and expands to accommodate new items hands-free (no manual Refresh).
Let’s just back up a sec and recap the pros and cons of the traditional formula-based reports and PivotTables. We need to understand these details in order to fully appreciate the beauty of the new solution that VSTACK/HSTACK enables.
Formula-based reports
One approach to building reports is to enter the report labels into cells, and then write formulas that compute the report values. Since the report values are computed with formulas, they automatically recalculate as the dependent cell values change. But, the problem is that they do not automatically expand to include any new items found in the updated data source. Meaning, if there is a new report label in the underlying data, you would need to manually insert a new worksheet row into your report, enter the new label, and then write or fill the formula to compute the value. The inability to auto-expand to include new items has been a major bummer. Which is why PivotTables have been such an amazing alternative to formula-based reports.
PivotTable Reports
PivotTable reports do automatically adjust their size to accommodate any new items found (ie, automatically create a new report row for any new items found in the underlying data). Which is awesome and one of the many reasons Excel users adore PivotTables. The only little problem is that users need to remember to manually click Refresh after changing the source data in the workbook.
Options
And, these have been our two basic options for literally decades. We would need to make a choice between these two options based on our workbook. One the one hand, we could create a formula-based report that recalcs the values hands-free, but, we would need to manually insert new report rows and fill formulas. On the other hand, we could create a PivotTable that automatically includes new items, but, requires a manual Refresh.
For literally years, I’ve wished for the best of both worlds. A formula-based report that would not only automatically recalculate values, but also dynamically expand to include new report labels (items).
Well friends, this wish has finally come true!
With the introduction of VSTACK and HSTACK, we are able to build such a report. Probably, the most beautiful report of all.
Note: VSTACK/HSTACK are not available in all Excel versions. For more information about availability:
 0:22:25
Top 30 *Advanced* Excel Tips to make you awesome ⚡💡
 1:10:56
☑️ Top 30 Advanced Excel Tips and Tricks
 0:14:35
Top 10 Advanced Excel Tips and Tricks
 0:25:38
Top 20 Microsoft Excel Tips & Tricks
 0:50:17
50 Ultimate Excel Tips and Tricks for 2020
 0:11:47
Advanced Pivot Table Techniques (to achieve more in Excel)
 0:07:36
I saw my boss do these 10 things in Excel!
 0:11:58
Advanced Excel - VLOOKUP Basics
 0:00:41
Advance excel tips & tricks.
 5:43:05
The Ultimate Excel Tutorial - Beginner to Advanced - 5 Hours!
 0:00:47
Excel Interview Question Tips and Tricks #excel #exceltips #exceltutorial #msexcel #microsoftexcel
 0:20:18
Intermediate Excel Skills, Tips, and Tricks Tutorial
 0:14:16
10 Ultimate Excel Tips And Tricks
 0:13:57
Top 5 Ultimate Advanced Excel Tips and Tricks
 0:10:38
19 Advanced Excel Shortcuts You Might Not Know
 0:52:40
Excel Formulas and Functions | Full Course
 0:22:07
Top 15 Advanced Excel 2016 Tips and Tricks
 0:31:00
✅ Top 30 Excel Tips and Tricks in Just 30 Minutes
 0:11:30
You Won't Believe These Crazy PIVOT TABLE Hacks!
 2:11:02
Top 10 Advanced Excel Tricks for Data Analysis - FREE Masterclass with Sample Files
 0:05:59
SURPRISING Advanced Filter TRICK in Excel (You've Never Heard Of!)
 0:28:30
☑️ Top 25 Advanced Pivot Table Tips & Tricks For Microsoft Excel
 0:11:33
Get Ahead With These 10 Advanced Excel Charts!
 3:43:41
Microsoft Excel 2021/365 Tutorial: 3.5+ Hours of Advanced Excel Training Course
Комментарии