filmov
tv
GDB Debugging: How to Debug a C/C++ program

Показать описание
What is the GNU GDB debugger?
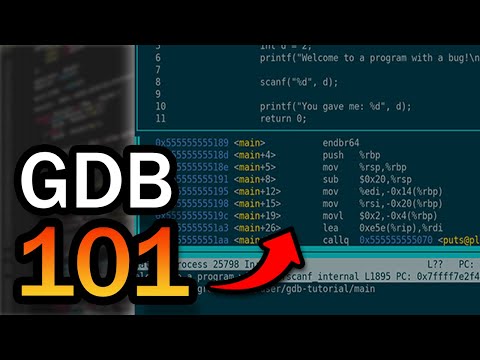
This video explains what is the GDB debugger and how to debug a C / C++ program inside the Linux terminal.
A debugger is a program that allows you to pause and resume the execution of your code and makes it easier for programmers to find bugs in their code.
We will execute the GDB tool step by step to explain the most popular commands to add breakpoints, watch variables, and pause/resume the execution of C and C++ code.
GDB is a powerful debugger that allows us to work with C and C++ code from inside the operating system terminal. Mastering GDB will help you evolve as a programmer and open doors to optimize your code and find potential errors.
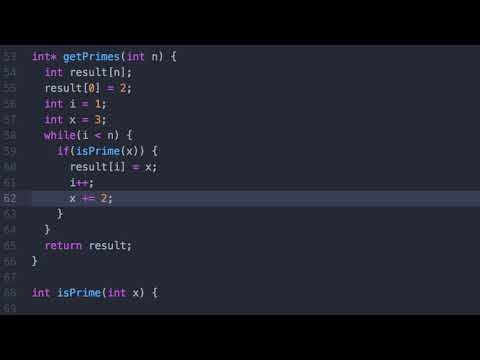
We will work with a very basic C sample code, where one of the functions is returning the wrong value as a result. With GDB we can break the execution, watch the value of the variables, and continue to inspect our code line by line.
For complete and comprehensive courses, including ones on the Linux operating system and other C and C++ development tools, visit:
SUBSCRIBE to learn more about computer science topics:
Follow me on Twitter:
This video explains what is the GDB debugger and how to debug a C / C++ program inside the Linux terminal.
A debugger is a program that allows you to pause and resume the execution of your code and makes it easier for programmers to find bugs in their code.
We will execute the GDB tool step by step to explain the most popular commands to add breakpoints, watch variables, and pause/resume the execution of C and C++ code.
GDB is a powerful debugger that allows us to work with C and C++ code from inside the operating system terminal. Mastering GDB will help you evolve as a programmer and open doors to optimize your code and find potential errors.
We will work with a very basic C sample code, where one of the functions is returning the wrong value as a result. With GDB we can break the execution, watch the value of the variables, and continue to inspect our code line by line.
For complete and comprehensive courses, including ones on the Linux operating system and other C and C++ development tools, visit:
SUBSCRIBE to learn more about computer science topics:
Follow me on Twitter:
 0:07:29
GDB is REALLY easy! Find Bugs in Your Code with Only A Few Commands
 0:16:43
Debugging C Programs with GDB
 0:18:07
GDB Debugging: How to Debug a C/C++ program
 0:23:42
9.2 - Debugging - GDB Tutorial
 0:13:51
Debugging Embedded Systems With GDB?
 0:11:03
Intro to Debugging w/ GDB (PicoCTF 2022 #11 'gdb-test-drive')
 0:07:07
you need to stop using print debugging (do THIS instead)
 0:08:07
Multiprocess debugging in GDB
 0:05:30
Debugging with Multiple Threads (gdb, pthreads)
 0:23:31
GDB Beginner Masterclass
 0:07:48
This Is 100% How You Should Be Debugging | How to Use OpenOCD to Debug Embedded Software with GDB
 0:14:47
CppCon 2015: Greg Law ' Give me 15 minutes & I'll change your view of GDB'
 0:03:31
Debugging multithreaded programs with GDB
 0:12:40
WHAT IS DEBUGGING | How to debug program using GDB in terminal and Eclipse IDE.
 0:13:44
How to debug C++ Programs using GDB (GNU Debugger) in Linux
 0:04:34
Debug faster with gdb layouts (TUI)
 0:04:42
gdb for pthread debug
 0:01:27
gdb core dump analysis for beginners
 0:07:15
Debugging made easy with gdb - Pointers
 0:02:03
Fix 'no debugging symbols found' Issue in GDB
 0:02:44
Debugging crash using gdb and valgrind
 0:54:26
Advanced Debugging with GDB
 0:55:12
GDB Tutorial
 0:36:35
Debugging the Linux kernel with GDB
Комментарии