filmov
tv
Advanced Debugging with GDB

Показать описание
In this video, we go deeper into GDB: conditional breakpoints, post-mortem debugging with coredumps, checkpoints, remote debugging and more.
 0:54:26
Advanced Debugging with GDB
 0:04:34
Debug faster with gdb layouts (TUI)
 0:16:43
Debugging C Programs with GDB
 0:07:07
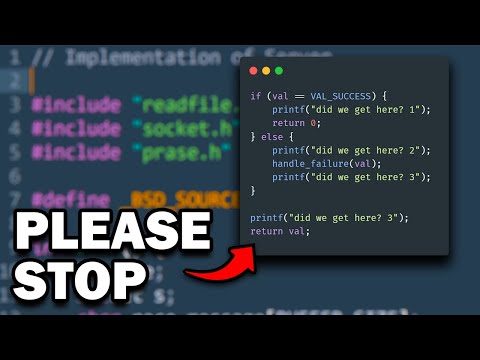
you need to stop using print debugging (do THIS instead)
 0:13:51
Debugging Embedded Systems With GDB?
 0:01:47
How to examine memory in GDB
 0:05:48
Debugging Like A Pro
 0:02:55
Debug Faster With Conditional Breakpoints (GDB)
 0:05:30
Debugging with Multiple Threads (gdb, pthreads)
 0:14:47
CppCon 2015: Greg Law ' Give me 15 minutes & I'll change your view of GDB'
 0:13:25
Using Valgrind and GDB together to fix a segfault and memory leak
 1:03:33
Greg Law, Mark Williamson — Getting the most out of GDB
 0:23:02
Roee Drucker: Lock & roll Advanced locks debugging with GDB
 0:11:18
debugging python segfaults with gdb (intermediate - advanced) anthony explains #208
 0:24:39
Debugging With GDB
 0:23:31
GDB Beginner Masterclass
 0:12:53
Command-Line Python Debugging with pdb
 0:11:03
Intro to Debugging w/ GDB (PicoCTF 2022 #11 'gdb-test-drive')
 0:59:09
CppCon 2016: Greg Law “GDB - A Lot More Than You Knew'
 0:08:15
getting a python stacktrace from gdb! (intermediate - advanced) anthony explains #410
 0:00:28
The HARDEST part about programming 🤦♂️ #code #programming #technology #tech #software #developer...
 0:08:07
Multiprocess debugging in GDB
 0:05:44
Advanced GDB Configuration Using JLink Drivers and Software
 0:11:52
Cross Debugging with GDB: Embedded Linux
Комментарии