filmov
tv
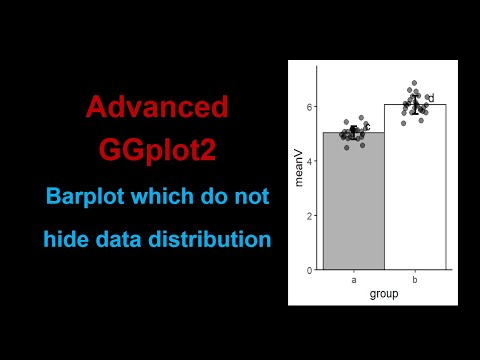
Advanced ggplot2: Barplot with highlights : Plot the plots as we see in research Journals

Показать описание
#rprogramming #barcharts #barplot #ggplot2
This tutorial series will help you to make plots which are at par with what we see in research journals.
In this video I have discussed:
1. How to get highlighted bars in barplot
2. customise the plot using theme elements
3. use scale_continuous to customise tick labels and plot origin
4. Add greek letters and superscripts in axis labels
5. Get text on the plot using annotate layers
6. Customise text elements using theme elements.
The original plot is from
I guessed the data from the plot and recreated it in this tutorial.
Facebook page:
Mail Id:
youtube playlist:
# data
# download the file and save it in your working directory and set that directory as a working directory by changing the path in setwd() .
# code
setwd("G:\\Rworks\\Barplots_highlights")
head(df)
tail(df)
summary(df)
library(dplyr)
x_breaks= 1:40
tick_labels[c(2:9,11:19,21:29,31:37,39:40)]=""
library(ggplot2)
geom_col(width=0.7,fill="black")+
scale_y_continuous(expand=c(0,0))+
theme_bw()+
text=element_text(size=26, color="black"),
expand_limits(y=c(0,2))+
scale_x_continuous(breaks=x_breaks, labels =tick_labels )+
ylab(expression(paste(Delta,delta,""^1,"H",""^15,"N (PPM)")))+
xlab("Residue number")+
annotate(geom="text",x=13, y=1.8, label="Δ(NCR169-ox1,NCR169-ox2)",size=9)
 0:13:54
Advanced ggplot2: Barplot with highlights : Plot the plots as we see in research Journals
 0:16:00
Advanced barplot: Barplot with overlayed points to visualise data distribution
 0:08:44
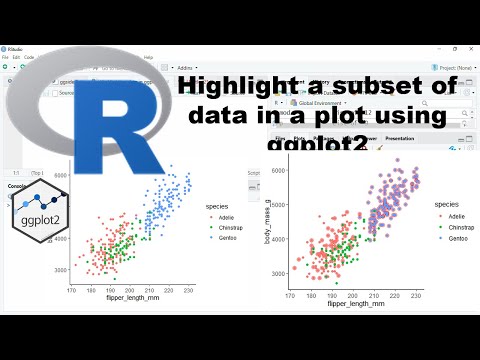
Highlight subset of data in a plot using ggplot2
 0:01:00
Create a Bar Plot in 60 secs | RStudio, ggplot2 and gghighlight
 0:07:37
Advanced ggplot - using facets
 0:15:55
ggplot2: From Bad Pie Charts to Polished Bars & Animation - Step by Step
 0:21:22
Advance Your Visualizations in R
 0:09:07
Ggplot made easy Advanced ggplot for Comparison of Distribution using Rain Cloud Plots in R
 0:05:50
Bar plot with facet and significant differences in R | Plotting in R
 0:12:17
ggplot2 explained 10 nice plots to visualise data disitribution, histo, denisty, boxplot, raincloud
 0:22:31
Barplot using R with error bar, Data Visualization, GGplot2, Plotting data ranking
 0:06:57
Stacking, dodging, and filling bar charts with ggplot2
 0:13:53
More with ggplot()
 0:01:33
R : Showing significance relationships in a ggplot2 bar graph
 0:20:03
Cédric Scherer—Outlier 2021—ggplot wizardy: my favorite tricks and secrets for beautiful plots in R...
 0:05:03
ggdensity: A new ggplot2 extension for high-density regions
 0:09:06
Better graphics with gghighlight in R!
 0:28:21
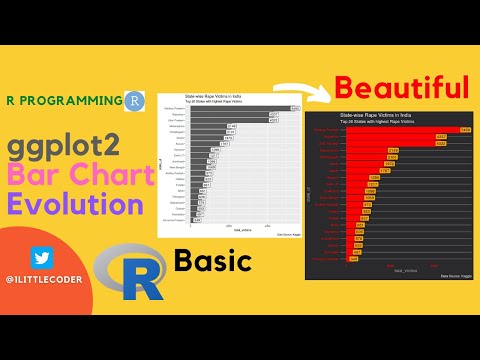
Make a beautiful ggplot2 Bar Chart from Basic to Powerful Themes
 0:09:42
Pirate plot: Advanced data visulisation using R , RID plot
 0:14:28
R Tutorial - Advanced Line Graphs with ggplot in RStudio - YOY!
 0:13:23
HOW TO R STUDIO: GGPLOT2 BASICS
 0:19:23
How to plot barplots similar to those in journal articles using R and ggplot2 and other packages
 0:21:57
Visualizing Data in R with 'ggplot2' and 'ggThemeAssist' | R Tutorial (2020)
 0:07:09
Science of Data Visualization | Bar, scatter plot, line, histograms, pie, box plots, bubble chart
Комментарии