filmov
tv
Все публикации
0:11:51
How to plot distribution plots on margins of Scatter Plot using ggamarginal & ggscatridges packages
0:05:20
Understanding Data Distribution: Box Plot explained
0:10:32
Easy Regression plots in R programming: How to write regression equation on Scatter Plots?
0:06:50
How to make interactive plot using ggplot2 and plotly?
0:08:51
Data Visualization using ggplot2: How to plot progress using line plot
1:19:15
R Programming for Biologists: What R can do : growth rate,Survival Curve, Risk Table Studies & More!
0:15:18
Easily create elegant publication ready summary tables in R programming
0:11:06
Easy Data manipulation From wide to long data with pivot_longer() in R
0:21:21
ggplot made easy: Analyzing Distributions with R and ggplot2
0:13:09
ggplot made easy: Time Series Analysis with R and ggplot2
0:03:04
How to update TexStudio installtion and MiKTex packages
0:10:02
Easy R :Working with dates in R programming: Exploring the as.Date Function and Format Specifiers
0:15:31
3 Compact letter display(CLD) three way ANOVA and visualisation with R and ggplot2 part III
0:10:47
2 Compact letter display(CLD):Two way anova and visualistion using ggplot2
0:12:04
I - Compact Letter Display (CLD) One-Way ANOVA and CLD Visualization with R and ggplot2
0:07:45
Enhanced scatterplot : Side plots in ggplot2 using geom_*side^() of ggside package
0:11:20
Fitting linear regression model and prediction in R programming
0:08:44
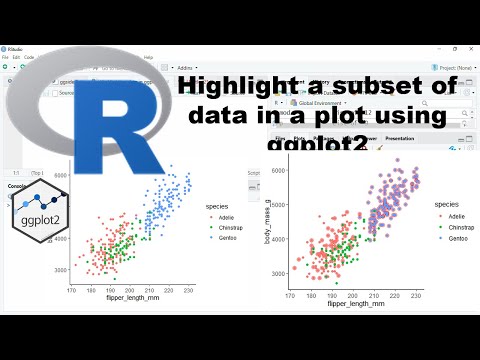
Highlight subset of data in a plot using ggplot2
0:09:39
Barplot with errorbars Using summary_stat() function in ggplot2 and R programming
0:08:18
missForest: Imputation of missing data using Random Forest approach in R programming
0:07:02
Amelia: Imputation of missing data using amelia() from package Amelia in R programming
0:11:26
How to impute missing data using mice package in R programming
0:13:46
Test of normality using R programming : Statistics with R
0:09:49
How to write our own theme in ggplot2
Вперёд
 0:11:51
 0:05:20
 0:10:32
 0:06:50
 0:08:51
 1:19:15
 0:15:18
 0:11:06
 0:21:21
 0:13:09
 0:03:04
 0:10:02
 0:15:31
 0:10:47
 0:12:04
 0:07:45
 0:11:20
 0:08:44
 0:09:39
 0:08:18
 0:07:02
 0:11:26
 0:13:46
 0:09:49