filmov
tv
Hypothesis Testing Differences Between Two Means With Two Samples - What Are Independent Samples
Показать описание
In this video we discuss how to do hypothesis testing for the differences between two means with two samples when the standard deviations are known. We also cover what are independent and dependent samples.
TIMESTAMPS
0:00 Intro - dependent and independent samples
0:06 What are independent samples with example
0:24 What are dependent samples with example
0:44 Using samples from populations
1:34 Test a claim using samples from populations
2:14 Rules for null and alternative hypotheses
2:36 Usual hypotheses pairings
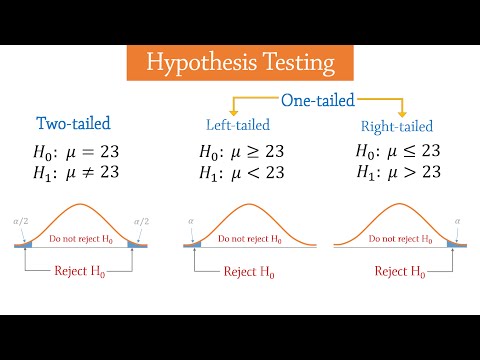
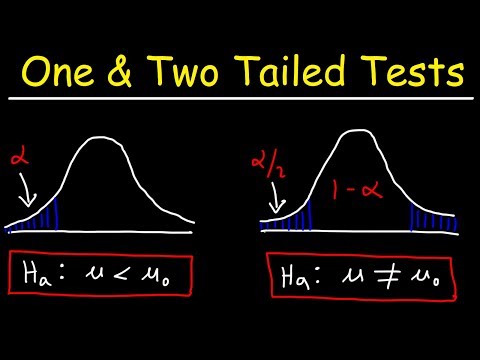
2:50 Type of hypothesis test, two-tailed, left-tailed, or right-tailed
2:59 Three different hypothesis tests for means with two samples
3:36 Z-test conditions
3:59 Rejection regions and critical values explained
4:39 Z-test formula for two sample hypothesis test
5:21 Standard error formula explained
5:49 Example of two sample hypothesis test
8:42 Decision to reject or fail to reject the null hypothesis
9:01 Interpret the decision to reject or fail to reject the null hypothesis
Transcript/notes (parital)
Two samples are independent when the first sample is not related to the second sample, for instance let’s say that sample 1 is daily time spent on social media by college males, and sample 2 is daily time spent on social media by college females. There is no possible pairing of members from the samples.
Two samples are dependent when each member of one sample is related or corresponds to a member of the other sample. An example of this is the weight of individuals before going on a diet, and the weight of those same individuals after 10 weeks of dieting. And dependent samples are often referred to as paired samples or matched samples.
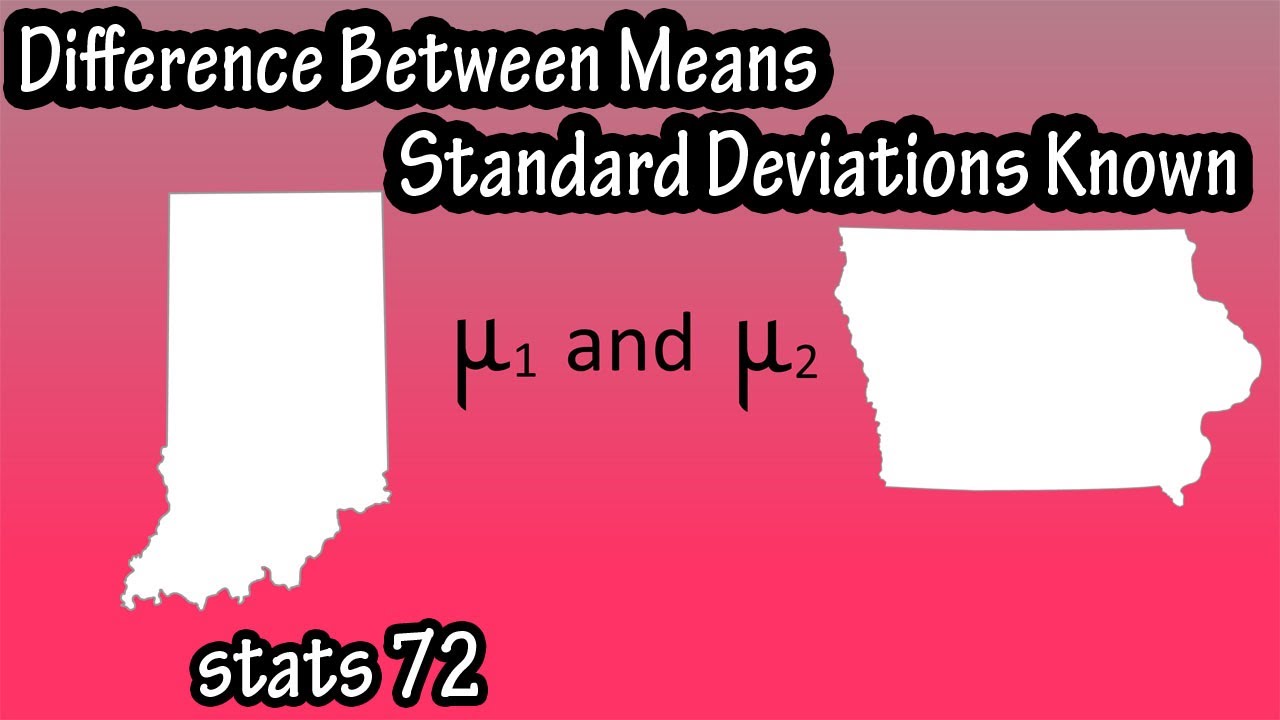
So, let’s say that we have 2 populations, population 1 and population 2, maybe monthly household income in Texas, and monthly household income in Vermont, and each of these populations has its own parameters, such as mew 1 and 2, the means, sigma squared 1 and 2, the variances, and sigma 1 and 2, the standard deviations.
Many times we want to compare parameters from populations, such as the means for monthly household income in Texas vs Vermont, mew 1 and mew 2, but it is many times impossible, or too costly to get all of the data from a population, so, we can get samples from the populations, sample 1 and sample 2, and calculate their statistics, such as their means, x bar 1 and 2, their standard deviations, s 1 and s2, and their sample sizes, n1 and n2.
In doing this we always start by assuming there is no difference between the population means, so the mean for population 1, mew 1, minus the mean for population 2, mew 2, equals 0 or mew 1 equals mew 2. This is important, remember, we always assume there is no difference between the population means.
Keep in mind that when we perform hypothesis tests with 2 independent samples, we are testing a claim about the differences between mew 1 and mew 2, the population means, not the actual values of mew 1 and mew 2.
For a 2 independent sample hypothesis, the null hypothesis, h sub 0, always contains a statement of equality, greater than or equal to, equal to, or less than or equal to. And the alternative hypothesis, h sub a, always contains a statement of inequality, greater than, not equal to, or less than.
The formula we use to calculate a standardized test statistic in a 2 sample z test is z equals the observed difference minus the hypothesized difference divided by the standard error, and mathematically this formula is z equals, x bar 1 minus x bar 2 minus mew 1 minus mew 2 divided by sigma of x bar 1 minus x bar 2.
The formula for the standard error is the square root of sigma squared one, divided by n1 plus sigma squared 2 divided by n2. Where sigma squared 1 is the variance, or the standard deviation squared for population 1, sigma squared 2 is the variance, or the standard deviation squared for population 2, and n1 and n2 are the sample sizes for sample 1 and sample 2.
A researcher claims there is a difference in the mean amount of money spent per month dining out of households in Iowa and Indiana. A random survey of 175 households in each state found a mean of $428 in Iowa and $496 in Indiana. Assume a standard deviation of $48 in Iowa and $59 in Indiana. Using a level of significance of alpha = 0.05, do the results support the researchers claim?
Step 1 is to make sure the 4 conditions are met.
Step 2 is to write the claim out and identify the null and alternative hypotheses.
Step 3 is to identify the level of significance, which was given, alpha = 0.05.
Step 4, is to determine the test to use.
Step 5 is to determine the critical value or values.
Step 6 is to identify the rejection regions.
Step 7, use the formula and calculate the z value, or the value of the standardized test statistic.
Step 8 is to make a decision to reject or fail to reject the null hypothesis.
Step 9 is to interpret the decision.
TIMESTAMPS
0:00 Intro - dependent and independent samples
0:06 What are independent samples with example
0:24 What are dependent samples with example
0:44 Using samples from populations
1:34 Test a claim using samples from populations
2:14 Rules for null and alternative hypotheses
2:36 Usual hypotheses pairings
2:50 Type of hypothesis test, two-tailed, left-tailed, or right-tailed
2:59 Three different hypothesis tests for means with two samples
3:36 Z-test conditions
3:59 Rejection regions and critical values explained
4:39 Z-test formula for two sample hypothesis test
5:21 Standard error formula explained
5:49 Example of two sample hypothesis test
8:42 Decision to reject or fail to reject the null hypothesis
9:01 Interpret the decision to reject or fail to reject the null hypothesis
Transcript/notes (parital)
Two samples are independent when the first sample is not related to the second sample, for instance let’s say that sample 1 is daily time spent on social media by college males, and sample 2 is daily time spent on social media by college females. There is no possible pairing of members from the samples.
Two samples are dependent when each member of one sample is related or corresponds to a member of the other sample. An example of this is the weight of individuals before going on a diet, and the weight of those same individuals after 10 weeks of dieting. And dependent samples are often referred to as paired samples or matched samples.
So, let’s say that we have 2 populations, population 1 and population 2, maybe monthly household income in Texas, and monthly household income in Vermont, and each of these populations has its own parameters, such as mew 1 and 2, the means, sigma squared 1 and 2, the variances, and sigma 1 and 2, the standard deviations.
Many times we want to compare parameters from populations, such as the means for monthly household income in Texas vs Vermont, mew 1 and mew 2, but it is many times impossible, or too costly to get all of the data from a population, so, we can get samples from the populations, sample 1 and sample 2, and calculate their statistics, such as their means, x bar 1 and 2, their standard deviations, s 1 and s2, and their sample sizes, n1 and n2.
In doing this we always start by assuming there is no difference between the population means, so the mean for population 1, mew 1, minus the mean for population 2, mew 2, equals 0 or mew 1 equals mew 2. This is important, remember, we always assume there is no difference between the population means.
Keep in mind that when we perform hypothesis tests with 2 independent samples, we are testing a claim about the differences between mew 1 and mew 2, the population means, not the actual values of mew 1 and mew 2.
For a 2 independent sample hypothesis, the null hypothesis, h sub 0, always contains a statement of equality, greater than or equal to, equal to, or less than or equal to. And the alternative hypothesis, h sub a, always contains a statement of inequality, greater than, not equal to, or less than.
The formula we use to calculate a standardized test statistic in a 2 sample z test is z equals the observed difference minus the hypothesized difference divided by the standard error, and mathematically this formula is z equals, x bar 1 minus x bar 2 minus mew 1 minus mew 2 divided by sigma of x bar 1 minus x bar 2.
The formula for the standard error is the square root of sigma squared one, divided by n1 plus sigma squared 2 divided by n2. Where sigma squared 1 is the variance, or the standard deviation squared for population 1, sigma squared 2 is the variance, or the standard deviation squared for population 2, and n1 and n2 are the sample sizes for sample 1 and sample 2.
A researcher claims there is a difference in the mean amount of money spent per month dining out of households in Iowa and Indiana. A random survey of 175 households in each state found a mean of $428 in Iowa and $496 in Indiana. Assume a standard deviation of $48 in Iowa and $59 in Indiana. Using a level of significance of alpha = 0.05, do the results support the researchers claim?
Step 1 is to make sure the 4 conditions are met.
Step 2 is to write the claim out and identify the null and alternative hypotheses.
Step 3 is to identify the level of significance, which was given, alpha = 0.05.
Step 4, is to determine the test to use.
Step 5 is to determine the critical value or values.
Step 6 is to identify the rejection regions.
Step 7, use the formula and calculate the z value, or the value of the standardized test statistic.
Step 8 is to make a decision to reject or fail to reject the null hypothesis.
Step 9 is to interpret the decision.
 0:18:36
Hypothesis Testing - Difference of Two Means - Student's -Distribution & Normal Distributio...
 0:03:41
One-Tailed vs Two-Tailed Hypothesis Tests | 2-sided vs lower and upper tails
 0:04:00
Hypothesis Testing - Introduction
 0:13:34
Hypothesis Testing Problems - Z Test & T Statistics - One & Two Tailed Tests 2
 0:07:22
What is the difference between parametric and nonparametric hypothesis testing?
 0:10:35
Hypothesis Testing With Two Proportions
 0:10:07
Hypothesis test for difference of means | Probability and Statistics | Khan Academy
 0:14:41
Hypothesis Testing and The Null Hypothesis, Clearly Explained!!!
 0:51:16
Day-6 Hypothesis Development and Testing
 0:09:39
Hypothesis Testing Differences Between Two Means With Two Samples - What Are Independent Samples
 0:05:55
Hypothesis Testing The Difference Between Two Proportions - Two Sample Z-Test
 0:06:56
Two-sample t test for difference of means | AP Statistics | Khan Academy
 0:06:52
Hypothesis Testing - Null and Alternative Hypotheses
 0:15:27
HYPOTHESIS TESTING BASICS: Type 1/Type 2 errors | Statistical power
 0:18:02
Hypothesis Testing - Comparison of Two Means
 0:05:40
Hypothesis test for 2 Population Means using Excel’s Data Analysis
 0:10:12
Hypothesis Test for a Difference Between Two Means (unpaired)
 0:15:07
T-test, ANOVA and Chi Squared test made easy.
 0:19:54
How To Know Which Statistical Test To Use For Hypothesis Testing
 0:00:13
Research Aptitude Part-8 | Types Of Hypothesis | Parametric & Non-Parametric Test | Nta Net Pape...
 0:00:51
Hypothesis Testing 🔥 Explained in 60 Seconds
 0:01:59
Statistical Significance, the Null Hypothesis and P-Values Defined & Explained in One Minute
 0:08:17
Hypothesis Testing: One Sided vs Two Sided Alternative | Statistics Tutorial #14 |MarinStatsLectures
 0:05:41
One Tailed and Two Tailed Tests, Critical Values, & Significance Level - Inferential Statistics
Комментарии