filmov
tv
Hypothesis test for difference of means | Probability and Statistics | Khan Academy

Показать описание
Hypothesis Test for Difference of Means
Missed the previous lesson?
Probability and statistics on Khan Academy: We dare you to go through a day in which you never consider or use probability. Did you check the weather forecast? Busted! Did you decide to go through the drive through lane vs walk in? Busted again! We are constantly creating hypotheses, making predictions, testing, and analyzing. Our lives are full of probabilities! Statistics is related to probability because much of the data we use when determining probable outcomes comes from our understanding of statistics. In these tutorials, we will cover a range of topics, some which include: independent events, dependent probability, combinatorics, hypothesis testing, descriptive statistics, random variables, probability distributions, regression, and inferential statistics. So buckle up and hop on for a wild ride. We bet you're going to be challenged AND love it!
About Khan Academy: Khan Academy offers practice exercises, instructional videos, and a personalized learning dashboard that empower learners to study at their own pace in and outside of the classroom. We tackle math, science, computer programming, history, art history, economics, and more. Our math missions guide learners from kindergarten to calculus using state-of-the-art, adaptive technology that identifies strengths and learning gaps. We've also partnered with institutions like NASA, The Museum of Modern Art, The California Academy of Sciences, and MIT to offer specialized content.
For free. For everyone. Forever. #YouCanLearnAnything
Subscribe to KhanAcademy’s Probability and Statistics channel:
 0:18:36
Hypothesis Testing - Difference of Two Means - Student's -Distribution & Normal Distributio...
 0:10:07
Hypothesis test for difference of means | Probability and Statistics | Khan Academy
 0:04:00
Hypothesis Testing - Introduction
 0:13:34
Hypothesis Testing Problems - Z Test & T Statistics - One & Two Tailed Tests 2
 0:06:52
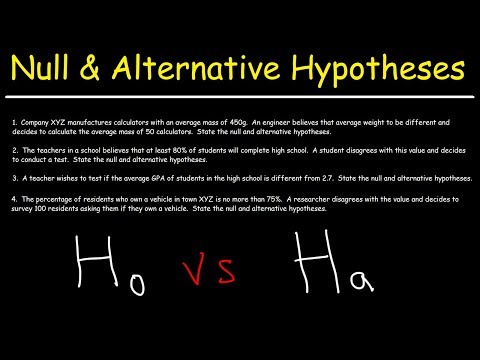
Hypothesis Testing - Null and Alternative Hypotheses
 0:14:41
Hypothesis Testing and The Null Hypothesis, Clearly Explained!!!
 0:08:07
What is a hypothesis test? A beginner's guide to hypothesis testing!
 0:07:22
What is the difference between parametric and nonparametric hypothesis testing?
 0:51:16
Day-6 Hypothesis Development and Testing
 0:03:41
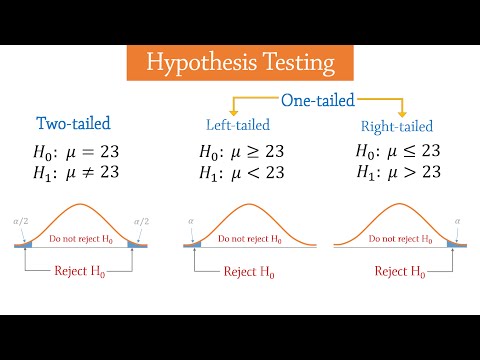
One-Tailed vs Two-Tailed Hypothesis Tests | 2-sided vs lower and upper tails
 0:06:56
Two-sample t test for difference of means | AP Statistics | Khan Academy
 0:09:19
Hypothesis test for difference in proportions | AP Statistics | Khan Academy
 0:10:35
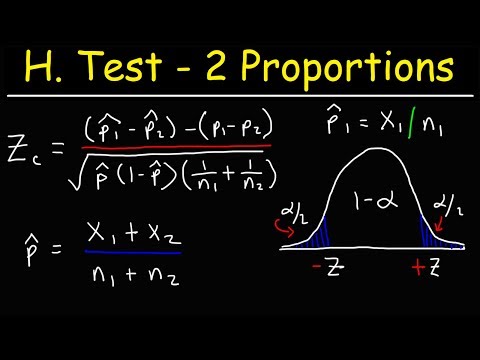
Hypothesis Testing With Two Proportions
 0:00:51
Hypothesis Testing 🔥 Explained in 60 Seconds
 0:19:54
How To Know Which Statistical Test To Use For Hypothesis Testing
 0:03:49
Null and alternative hypotheses with Lindsey Leach
 0:01:59
Statistical Significance, the Null Hypothesis and P-Values Defined & Explained in One Minute
 0:12:56
Matched or Paired Samples T-Test - Hypothesis Testing
 0:00:13
Research Aptitude Part-8 | Types Of Hypothesis | Parametric & Non-Parametric Test | Nta Net Pape...
 0:06:00
Test Statistic For Means and Population Proportions
 0:15:07
T-test, ANOVA and Chi Squared test made easy.
 0:05:27
Hypothesis Test vs. Confidence Interval | Statistics Tutorial #15 | MarinStatsLectures
 0:06:58
Hypothesis tests on one mean: t test or z test?
 0:10:28
Hypothesis test for difference in proportions example | AP Statistics | Khan Academy
Комментарии