filmov
tv
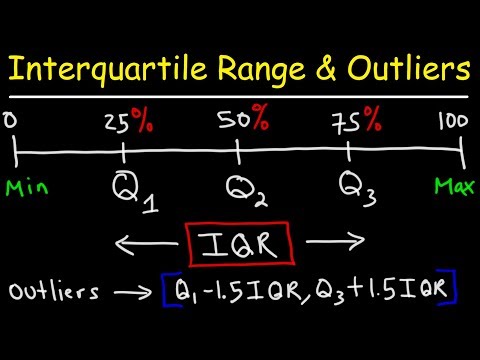
Outliers - Box and Whisker Plot (1.5 IQR)

Показать описание
Learn how to find which data points are outliers using a box and whisker plot. We discuss the method of working with 1.5 times the interquartile range to find out which data points are outliers. We also discuss how to construct a box and whisker plot by finding the median, lower quartile, upper quartile, maximum and minimum.
Jump to Section of this Video:
0:06 What is an outlier?
0:28 How to create a box and whisker plot
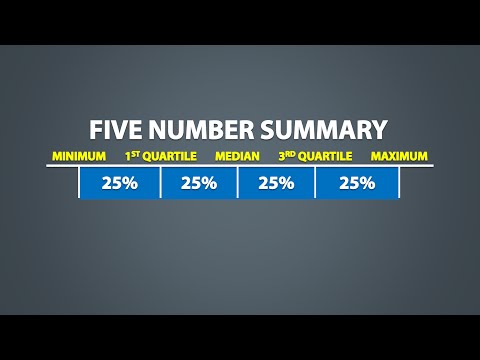
0:36 How to find the median
0:54 How to find the median when there is an even number
1:17 How to find the Upper Quartile and Lower Quartile
1:57 How to graph box and whisker plot on number line
2:33 How to graph the whiskers using the minimum and maximum
2:44 How to find the IQR (interquartile range)
3:08 Use 1.5 IQR to find outliers
Related Videos to Help you Succeed with Math:
Firstly, If you like my teaching style Subscribe to the Channel
Algebra 2 Final Exam Review
Take Your Learning to the Next Level with me!:
Get my Learn Algebra 2 Video Course (Preview 13 free video lessons & learn more)
Learn Algebra 1 Video Course
Looking to raise your math score on the ACT and new SAT?
Check out my Huge ACT Math Video Course and my Huge SAT Math Video Course for sale at
* Organized List of My Video Lessons to Help You Raise Your Scores & Pass Your Class. Videos Arranged by Math Subject as well as by Chapter/Topic. (Bookmark the Link Below)
Jump to Section of this Video:
0:06 What is an outlier?
0:28 How to create a box and whisker plot
0:36 How to find the median
0:54 How to find the median when there is an even number
1:17 How to find the Upper Quartile and Lower Quartile
1:57 How to graph box and whisker plot on number line
2:33 How to graph the whiskers using the minimum and maximum
2:44 How to find the IQR (interquartile range)
3:08 Use 1.5 IQR to find outliers
Related Videos to Help you Succeed with Math:
Firstly, If you like my teaching style Subscribe to the Channel
Algebra 2 Final Exam Review
Take Your Learning to the Next Level with me!:
Get my Learn Algebra 2 Video Course (Preview 13 free video lessons & learn more)
Learn Algebra 1 Video Course
Looking to raise your math score on the ACT and new SAT?
Check out my Huge ACT Math Video Course and my Huge SAT Math Video Course for sale at
* Organized List of My Video Lessons to Help You Raise Your Scores & Pass Your Class. Videos Arranged by Math Subject as well as by Chapter/Topic. (Bookmark the Link Below)
 0:04:23
Outliers - Box and Whisker Plot (1.5 IQR)
 0:06:22
How to Make a Boxplot with Outliers
 0:03:44
Finding Outliers & Modified Boxplots 1.5(IQR) Rule
 0:03:41
Box and Whisker Plot with Outliers
 0:13:56
How To Make Box and Whisker Plots
 0:08:25
Box and Whisker Plots Explained | Understanding Box and Whisker Plots (Box Plots) | Math with Mr. J
 0:14:27
Box and Whisker Plot with outliers
 0:07:00
Boxplot with Outliers
 0:06:39
Box-Plot (Simply explained and create online)
 0:06:26
Box and Whiskers Plot with Outliers
 0:12:33
How To Find The Interquartile Range & any Outliers - Descriptive Statistics
 0:08:01
How To Create A Box Plot In Excel (Including Outliers)
 0:03:24
Five Number Summary, Boxplots, and Outliers | Statistics Exercises
 0:00:59
Detecting outliers 📊 #outliers #datascience #boxplot #shorts
 0:02:38
Determining an Outlier Using the 1.5 IQR Rule
 0:09:59
Box and Whisker Plots with Outliers | Milanese Math Tutorials
 0:04:22
Creating a Box and Whisker Plot with Outliers
 0:05:37
The Five Number Summary, Boxplots, and Outliers (1.6)
 0:01:13
Mild and Extreme Outliers
 0:01:11
How To Make a Box Plot in Excel 2022 | Windows and Mac
 0:16:09
Box and Whisker Plots - Skewness and Outliers : ExamSolutions Maths Revision
 0:06:24
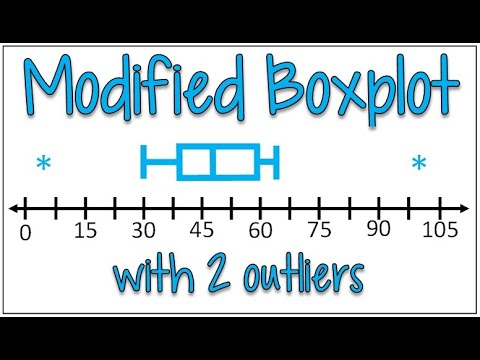
Modified Boxplot with 2 Outliers
 0:04:06
Understanding Boxplot and Outliers - Learning from Data
 0:13:25
How to Create a Box Plot in Excel (With Outliers and Mean Values)
Комментарии