filmov
tv
Interactive Excel Dashboard - The Full Tutorial

Показать описание
The full tutorial of creating an excel dashboard from scratch. In this video, we will build an interactive and dynamic excel dashboard from scratch using the sample data provided below. First, we prepare the base of our dashboard by removing the gridlines on the sheet and making sure that no cell has any color/value yet. Then we create the overall structure of our dashboard using the shapes which are readily available on Excel. Then we add the outline and label the shapes to Dashboard Title, Slicers / Filters, Metrics, and Charts. After that, we will start working with our data and create Pivot Tables. Then we connect our Metrics to the Pivot Table. We’ll also create Pivot Charts. Then we customize our dashboard to make it look more polished and professional. Finally, we’ll add the slicers.
iDATA Analytics Hub provides free tutorial videos for Data Visualization, Data Storytelling and Data Analytics.
 0:19:21
📊 How to Build Excel Interactive Dashboards
 0:18:57
Interactive Excel Dashboard Tutorial in 3 Steps (+ FREE Template)
 0:19:41
Make an Interactive Excel Dashboard in 4 Simple Steps!
 0:46:19
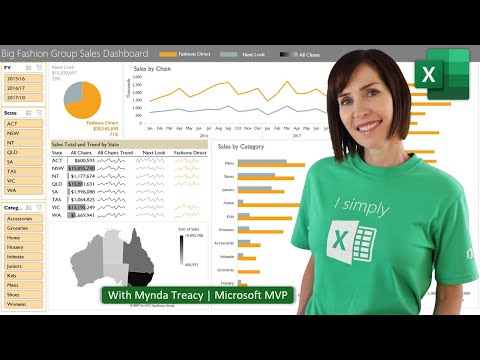
Interactive Excel Dashboard - The Full Tutorial
 0:19:32
Interactive Excel Dashboard for BETTER Data Visualization (Free Download)
 0:40:32
Create interactive excel dashboard in 5 simple steps #exceldashboard #exceltutorial #pivottable
 0:52:26
Interactive Excel Dashboards & ONE CLICK Update!
 0:12:39
Smart Excel Pivot Table Trick - Choose Your KPI from Slicer (Excel Dashboard with DAX)
 0:58:52
Free Power BI Training 2025 | Chapter - 6 | Complete Step-by-Step Course with Hands-On
 0:30:37
How to build Dynamic & Interactive Dashboard in EXCEL with Pivot Tables&Charts | Tutorial Ep...
 0:05:56
Create an Interactive Excel Dashboard In Under 3 MINUTES!
 0:00:20
How to Make INTERACTIVE Excel Dashboards - Step by Step Guide
 0:28:08
How to make an Excel Dashboard in 5 Easy Steps (Interactive + Free File)
 0:07:22
How to Build an Interactive Excel Dashboard (Step-by-Step Tutorial)
 0:08:32
How I Built a ONE CLICK Excel Dashboard with ChatGPT 😎
 0:00:58
How to Create Dynamic Dashboards in Excel
 0:13:53
Create INTERACTIVE Excel Dashboards With Option Buttons | How to use Radio Buttons
 0:53:50
Interactive Excel HR Dashboard - FREE Download
 0:00:45
How to create an interactive dashboard in less than 30 seconds. 🤯 #excel #tutorial
 0:00:50
Adding a menu in #excel to make navigating your #dashboards a bit easier
 0:14:43
Excel Dashboard Course #21 - Creating a Pivot table Dashboard with Slicers in Excel (in 15 minutes)
 0:54:08
How to Create Impressive Interactive Excel Dashboard | Ultimate Excel Dashboard Ep. 1
 1:14:30
Is This Microsoft Excel?! Financial Statistics Dashboards System | Tutorial 1
 0:00:16
Sales Dashboard in Excel
Комментарии