filmov
tv
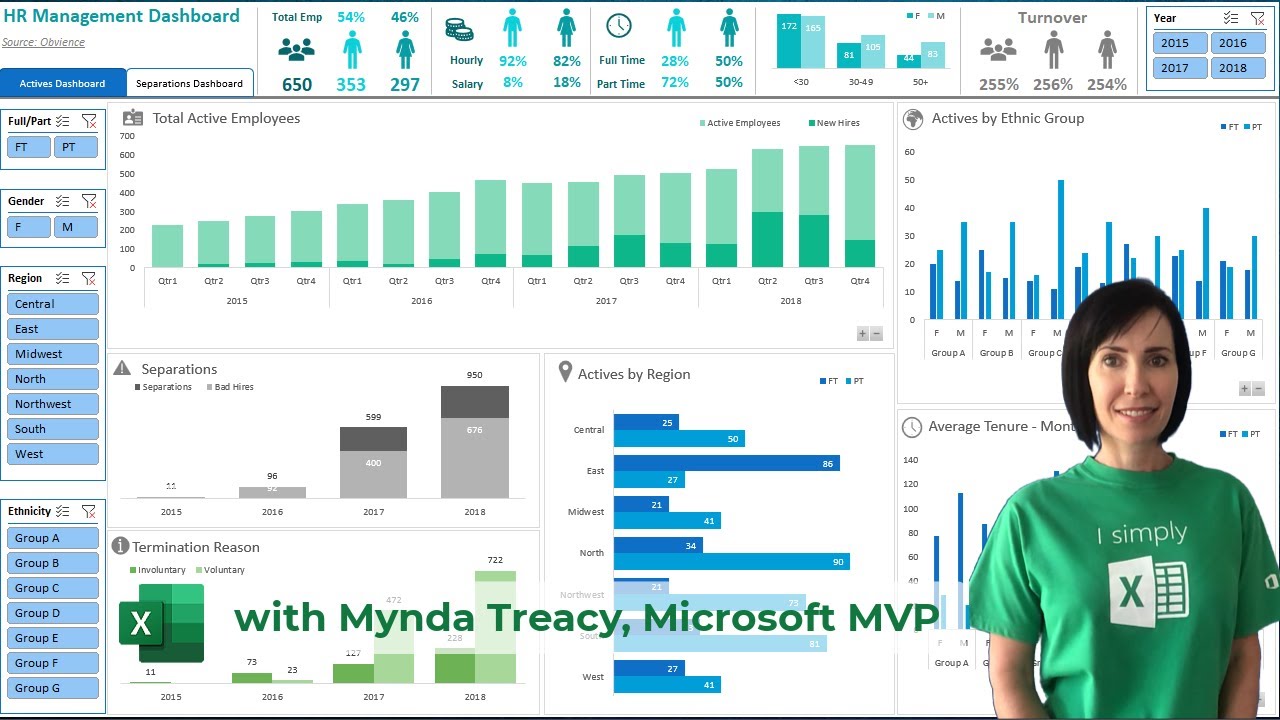
Interactive Excel HR Dashboard - FREE Download
Показать описание
In this video you will learn how to create an interactive HR dashboard from scratch using Excel's Power Query and Power Pivot tools. Applies to Excel 2010 onward for Windows only.
🎓 LEARN MORE
💬 Please leave me a COMMENT. I read them all!
🎁 SHARE this video and spread the Excel love.
Or if you’re short of time, please click the 👍
⏲ TIMESTAMPS
0:00 Introduction
1:02 Get Data with Power Query
6:09 Active Employess Column Chart
13:59 Ethnic Group Column Chart
20:51 Separations & Termination Column Charts
25:01 Headline Visuals
39:20 Slicers
44:23 Color Formatting
46:07 Dashboard Tabs
49:08 Automatica Updating
50:27 Icons
52:15 Outro
 0:53:50
Interactive Excel HR Dashboard - FREE Download
 0:21:05
How to build an Interactive HR Dashboard in Excel | HR Analytics in Excel [2024]
 1:14:51
Build an interactive Human Resources Dashboard in Microsoft Excel - HR Dashboard
 1:29:48
Microsoft Excel Hr Attrition Dashboard | How to create an Excel Dashboard
 0:50:52
Excel Dashboard from start to end (Part 1) | HR Analytics Dashboard | Start to End Design
 0:38:56
NEW ADVANCED EXCEL HR DASHBOARD with Search bar: Interactive Excel Hr Dashboard part 3
 0:38:50
Interactive HR Dashboard in Excel
 0:19:21
📊 How to Build Excel Interactive Dashboards
 0:00:46
Excel Finance HR Dashboard
 0:36:27
HR Attrition and Head Count Analysis Dashboard in Excel | Complete Tutorial
 0:40:04
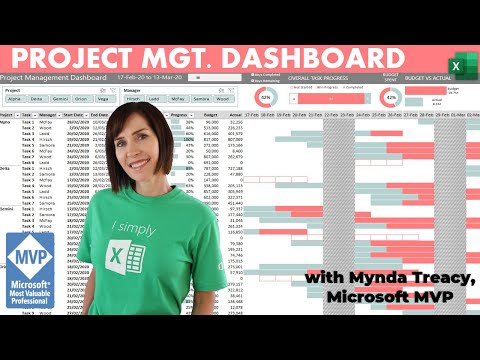
Interactive Excel Project Management Dashboard - FREE Download
 0:56:18
How to build an Interactive HR Dashboard in Excel!
 0:28:08
How to make an Excel Dashboard in 5 Easy Steps (Interactive + Free File)
 0:02:57
Create HR Dashboard in Excel - Free Dashboards and Templates
 0:03:25
Employee Dashboard in Excel
 0:37:26
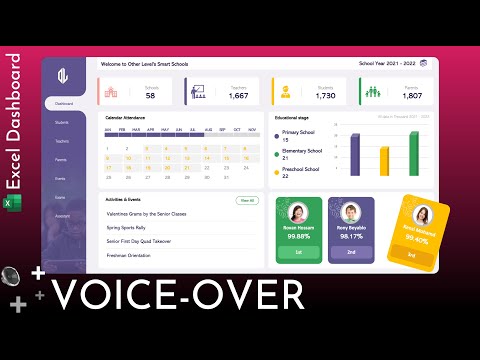
Excel Dashboard for Schools with changing students images dynamically | Full Tutorial + Voiceover
 1:03:06
HR Management Interactive Dashboard in Excel | 2021
 1:11:40
Excel Dashboard Course #18 - Creating a Human Resource (HR) Training Dashboard
 0:40:32
Create interactive excel dashboard in 5 simple steps #exceldashboard #exceltutorial #pivottable
 2:18:54
Make an Amazing HR Dashboard in Excel - FREE Live Masterclass
 0:41:23
Interactive Dashboard Step by Step + FREE File Download
 0:01:05
HR Training Dashboard Excel Template
 0:52:26
Interactive Excel Dashboards & ONE CLICK Update!
 0:30:37
How to build Dynamic & Interactive Dashboard in EXCEL with Pivot Tables&Charts | Tutorial Ep...
Комментарии