filmov
tv
Learn SPSS in 1 Hour | SPSS Tutorial for Beginners to Advance| SPSS Complete Course Free| SPSS Tutor

Показать описание
Master SPSS in just 1 hour with our comprehensive tutorial for beginners to advance users! This free SPSS complete course covers everything you need to know about data analysis. Learn SPSS from scratch with our expert SPSS tutor guiding you every step of the way. #LearnSPSS #SPSSTutorial #DataAnalysisCourse.
The course takes you from absolute beginner of SPSS and statistics with lessons such as getting familiar with the SPSS interface, creating variables, entering data, and running, interpreting and reporting basic analyses. From there, you will be introduced to inferential tests and hypothesis testing with statistics such as t-tests, ANOVA and linear regressions.
TimeStamps:
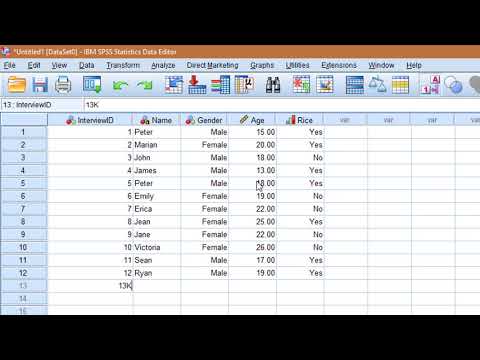
00:00 - Enter Data and Define Variables in SPSS
08:06 - Interpreting percentages from a cross tabulation table in SPSS
12:14 - Compute a Total Score in SPSS
13:48 - Compute a Mean Score in SPSS
15:57 - Create Dummy Variables in SPSS
20:12 - Change the coding of a variable using 'Recode into same variable' in SPSS
22:12 - Record Scale Variables into Categories in SPSS
26:28 - Reduce Number of Groups for a Categorical Variable in SPSS
30:25 - Reverse the Coding of a Variable in SPSS
34:46 - Run an Independent t-test in SPSS
36:18 - Scatter plot in SPSS
37:32 - Compute correlations in SPSS: Spearman's rho
39:39 - Compute correlations in SPSS: Pearson's r
42:05 - Interpret SPSS output for correlations: Pearson's r
45:13 - Interpret SPSS output for correlations: Spearman's rho
48:05 - Interpret SPSS output for an independent t-test
52:14 - Run a paired t-test in SPSS
53:27 - Interpret SPSS output for a paired t-test
57:37 - Chi-square test in SPSS + interpretation (assumptions violated)
01:02:33 - Chi-square test in SPSS + interpretation
01:07:29 - Select specific cases to analyze in SPSS
01:12:27 - Edit charts in SPSS: Example using a clustered bar chart
01:16:50 - Edit charts in SPSS: Example using a scatterplot
01:21:29 - Select random sample of data using 'Select Cases' in SPSS
01:24:23 - Split your data file by a categorical variable in SPSS
01:28:06 - Calculate Z-Score in SPSS
______________________/SOCIAL LINKS\_____________________________
For Help Contact Me on my👇👇
___________________________________________________________________
HELP ME MAKE A DREAM OF 10,000 SUBSCRIBERS ??Disclaimer: All contents provided by this channel is meant for EDUCATIONAL purpose only.
Please don't forget to LIKE, SHARE, AND SUBSCRIBE. Let us Keep the love and support burning. Love you all. ????
#spss #spsshorts #ttest #ecnomics #economie #variable #coding
Logo Music:
thanks for watching...
#spss
#spssTutor
#spssCourse
The course takes you from absolute beginner of SPSS and statistics with lessons such as getting familiar with the SPSS interface, creating variables, entering data, and running, interpreting and reporting basic analyses. From there, you will be introduced to inferential tests and hypothesis testing with statistics such as t-tests, ANOVA and linear regressions.
TimeStamps:
00:00 - Enter Data and Define Variables in SPSS
08:06 - Interpreting percentages from a cross tabulation table in SPSS
12:14 - Compute a Total Score in SPSS
13:48 - Compute a Mean Score in SPSS
15:57 - Create Dummy Variables in SPSS
20:12 - Change the coding of a variable using 'Recode into same variable' in SPSS
22:12 - Record Scale Variables into Categories in SPSS
26:28 - Reduce Number of Groups for a Categorical Variable in SPSS
30:25 - Reverse the Coding of a Variable in SPSS
34:46 - Run an Independent t-test in SPSS
36:18 - Scatter plot in SPSS
37:32 - Compute correlations in SPSS: Spearman's rho
39:39 - Compute correlations in SPSS: Pearson's r
42:05 - Interpret SPSS output for correlations: Pearson's r
45:13 - Interpret SPSS output for correlations: Spearman's rho
48:05 - Interpret SPSS output for an independent t-test
52:14 - Run a paired t-test in SPSS
53:27 - Interpret SPSS output for a paired t-test
57:37 - Chi-square test in SPSS + interpretation (assumptions violated)
01:02:33 - Chi-square test in SPSS + interpretation
01:07:29 - Select specific cases to analyze in SPSS
01:12:27 - Edit charts in SPSS: Example using a clustered bar chart
01:16:50 - Edit charts in SPSS: Example using a scatterplot
01:21:29 - Select random sample of data using 'Select Cases' in SPSS
01:24:23 - Split your data file by a categorical variable in SPSS
01:28:06 - Calculate Z-Score in SPSS
______________________/SOCIAL LINKS\_____________________________
For Help Contact Me on my👇👇
___________________________________________________________________
HELP ME MAKE A DREAM OF 10,000 SUBSCRIBERS ??Disclaimer: All contents provided by this channel is meant for EDUCATIONAL purpose only.
Please don't forget to LIKE, SHARE, AND SUBSCRIBE. Let us Keep the love and support burning. Love you all. ????
#spss #spsshorts #ttest #ecnomics #economie #variable #coding
Logo Music:
thanks for watching...
#spss
#spssTutor
#spssCourse
 1:31:13
Learn SPSS in 1 Hour | SPSS Tutorial for Beginners to Advance| SPSS Complete Course Free| SPSS Tutor
 0:15:15
Learn SPSS in 15 minutes
 2:16:58
SPSS for Beginners - Full Course
 0:10:16
01 How to Use SPSS - An Introduction to SPSS for Beginners
 1:59:35
SPSS course for beginners: Stats basics, creating variables, data entry, descriptive stats
 2:32:36
Data Analysis using SPSS Software
 2:04:53
Complete SPSS Tutorial 2 Hour complete course
 0:20:52
Learn SPSS IN 20 MINUTES. GO FROM ZERO TO HERO IN SPSS QUICKLY. ULTIMATE BEGINNERS GUIDE TO SPSS
 1:42:57
Day-1 Introduction to SPSS
 0:54:51
learn Complete SPSS IN 1 hour in Urdu.
 0:10:14
Learn basics of SPSS in 10 minutes | Data Entry in SPSS | Scale, ordinal, Nominal Variables |
 2:19:05
Let's Learn SPSS with Interpretations
 0:45:09
Learn SPSS in 45 Minutes
 0:00:45
SPSS - Mean, Median, Mode, Standard Deviation & Range
 8:15:04
Statistics - A Full University Course on Data Science Basics
 1:46:55
193: LEARN SPSS IN 30 MINUTES
 1:11:54
MODULE 1: DATA MANAGEMENT AND ANALYSIS USING SPSS TRAINING COURSE
 0:09:42
Learn SPSS in 10 minutes | Introduction to SPSS | In Hindi
 0:26:31
SPSS Basic Operation 1 Video
 0:42:40
Easiest way to learn SPSS
 0:00:58
How much does an IT Analyst make?
 0:42:09
Teach me STATISTICS in half an hour! Seriously.
 0:11:42
SPSS Tutorial: 10-Minute Guide for Beginners
 1:01:29
Predictive Analytics in 1 Hour – a no nonsense quick guide
Комментарии