filmov
tv
Learn SPSS IN 20 MINUTES. GO FROM ZERO TO HERO IN SPSS QUICKLY. ULTIMATE BEGINNERS GUIDE TO SPSS

Показать описание
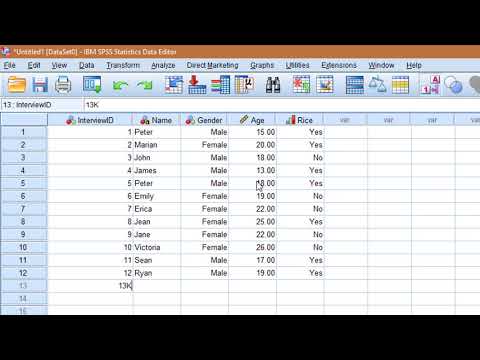
This is the ultimate beginners guide to everything SPSS. In this video, I take you through the SPSS graphical user interface, Defining Variables, entering data manually, running basic analysis, drawing charts and saving data.
My other Amazing channels
Tools used for this video
- Iphone 13 pro max for Camera-
Timecodes
0:00 Introduction
0:48 Video outline
1:10 Questionnaire intro
1:24 SPSS Graphical User Interphase (GUI)
3:07 Creating and defining variables
13:05 Manual data entry
14:20 Basic data analysis
18:40 Chart basics
 0:20:52
Learn SPSS IN 20 MINUTES. GO FROM ZERO TO HERO IN SPSS QUICKLY. ULTIMATE BEGINNERS GUIDE TO SPSS
 0:15:15
Learn SPSS in 15 minutes
 0:13:38
SPSS MADE EASY| LEARN HOW TO USE SPSS IN 20 MINUTES
 0:19:45
Learn SPSS in 20 Minutes | Introduction to SPSS | Urdu Tutorial
 0:45:09
Learn SPSS in 45 Minutes
 0:13:38
SPSS: How to enter and analyze data from a questionnaire
 0:09:42
Learn SPSS in 10 minutes | Introduction to SPSS | In Hindi
 0:32:33
SPSS for Beginners | Learn SPSS in 30 Minutes | Class in Urdu / Hindi
 2:18:11
Data Analytics Processes: Collection, Manipulation, and Cleaning
 0:08:16
Learn SPSS data analysis, interpretation and APA reporting for beginners in 7 minutes
 2:16:58
SPSS for Beginners - Full Course
 0:10:14
Learn basics of SPSS in 10 minutes | Data Entry in SPSS | Scale, ordinal, Nominal Variables |
 0:00:45
SPSS - Mean, Median, Mode, Standard Deviation & Range
 1:31:13
Learn SPSS in 1 Hour | SPSS Tutorial for Beginners to Advance| SPSS Complete Course Free| SPSS Tutor
 0:10:16
01 How to Use SPSS - An Introduction to SPSS for Beginners
 0:01:00
How to quickly run analyses in SPSS
 0:16:38
HOW TO USE SPSS | LEARN SPSS IN 16 MINS!!!!
 0:03:07
How to quickly Import Excel data into SPSS. Super Easy SPSS Tutorial in 3 minutes!!!
 1:46:55
193: LEARN SPSS IN 30 MINUTES
 1:59:35
SPSS course for beginners: Stats basics, creating variables, data entry, descriptive stats
 0:56:54
Master the Basics of using SPSS - 1/20/2022
 0:07:19
SPSS Basic Statistical Analysis: Done in 5 minutes
 0:05:11
Learn SPSS All Versions for Beginner (Easy and Fast Learning)
 0:43:31
SPSS for Beginners
Комментарии