filmov
tv
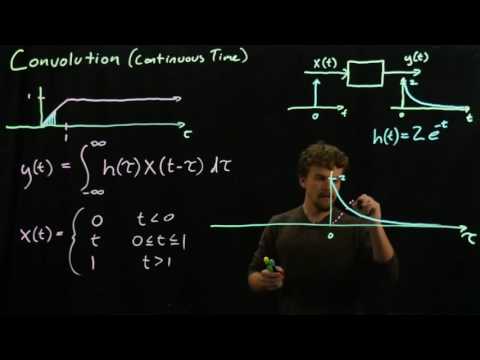
Graphical Evaluation of Continuous-Time Convolution

Показать описание
Convolution expresses the output of a linear time-invariant system in terms of the system's impulse response and the input. In this video you will learn a graphical approach to evaluating convolution for continuous-time systems. Learning how to interpret convolution graphically will develop your intuition for understanding how the impulse response characteristics impact the system output. For example, you can quickly determine where the output is zero, or whether it is increasing, decreasing or constant in certain time intervals. Understanding graphical convolution will prepare you to predict and analyze system behavior.
This video can be viewed without understanding graphical evaluation of discrete-time convolution. However, we recommend learning the discrete-time case first.
This video can be viewed without understanding graphical evaluation of discrete-time convolution. However, we recommend learning the discrete-time case first.
 0:14:53
Graphical Evaluation of Continuous-Time Convolution
 0:15:56
Convolution integral example - graphical method
 0:15:19
Graphical Evaluation of Discrete-Time Convolution
 0:06:20
Method to Calculate Continuous Convolution
 0:10:10
Discrete Time Convolution Example
 0:15:10
#112 Solved Problems on Convolution Integral // EC Academy
 0:08:14
Example of Graphical Discrete-Time Convolution
 0:21:46
Signals and Systems 49: Steps to Evaluate the Convolution of Continuous –Time Graphically
 0:27:18
Lecture 5 Module 3 Convolution Example Continuous Time
 0:15:10
Discrete Time Convolution
 0:24:25
Signals and Systems - Convolution theory and example
 0:13:44
Continuous-Time Convolution Example
 0:11:40
Graphical Convolution Integral
 0:18:35
Continuous Time Convolution || Example 2.6 & 2.7 || S&S 2.2.(1)(English)(Oppenheim)
 0:09:38
Graphical method of Convolution
 0:12:24
#110 Solved problems -2 on Convolution Sum || EC Academy
 0:23:01
But what is a convolution?
 0:38:06
M1 Lec6g|LTI systems| Convolution Integral| Graphical Method | Example Problem
 0:32:19
Signals&Systems week-4-1: Continuous-time Graphical Convolution
 0:11:16
Graphical convolution example
 0:13:42
Convolution by Image Method
 0:11:39
The Convolution Integral || Graphical Method of Convolution || Practice 15.12 || ENA 15.5(2)(U/H)
 0:15:12
SS2B2 CT Convolution Example using Graphical approach
 0:16:16
Graphical Convolution : Example 02
Комментарии