filmov
tv
Sketching the graph of multivariable functions

Показать описание
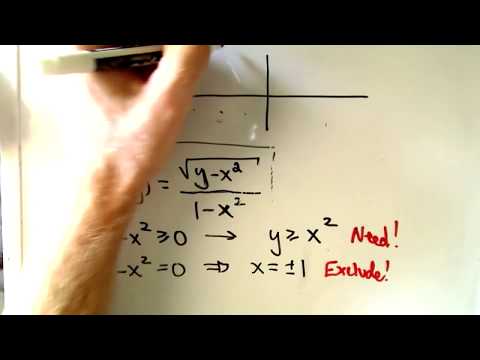
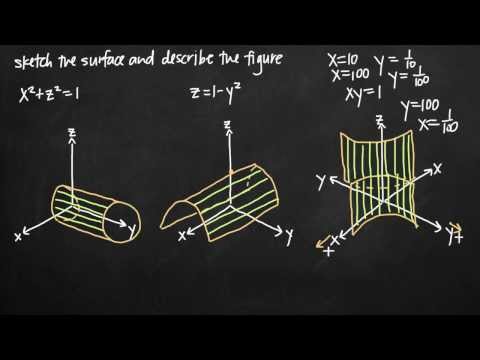
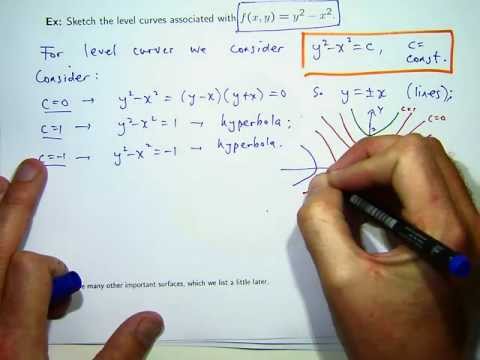
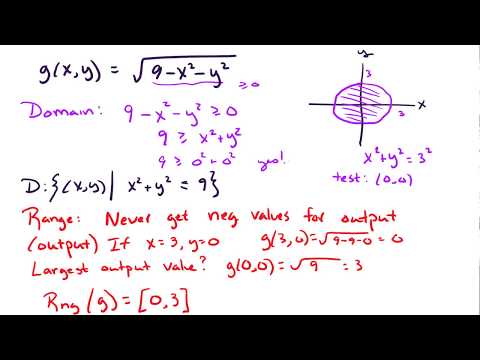
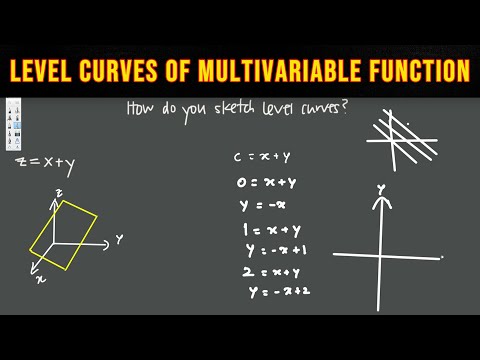
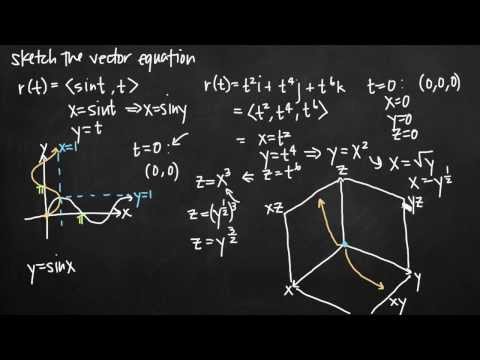
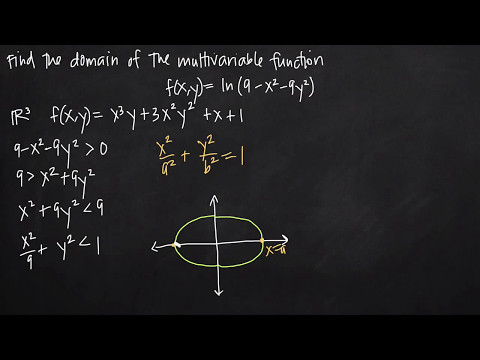
In this video, we learn how to sketch 3D graphs of some categories of multivariable functions, namely 3D plane, cylinder and sphere, cone and paraboloid, by using the ideas of level curves in some examples.
 0:11:31
 0:07:54
 0:06:21
 0:11:07
 0:23:06
 0:08:05
 0:09:22
 1:49:07
 0:18:27
 0:10:45
 0:30:06
 0:09:55
 0:05:51
 0:03:23
 0:03:22
 0:03:58
 0:07:27
 0:11:41
 0:02:25
 0:11:01
 0:28:46
 0:05:01
 0:05:37
 0:27:31