filmov
tv
EEVblog #396 - Bode Plotting on Your Osciloscope

Показать описание
Dave shows you a neat trick on how to get a real time frequency response bode plot on your oscilloscope using your function generator. Useful for filter or system response characterisation.
EEVblog Main Web Site:
EEVblog Amazon Store:
Donations:
Projects:
Electronics Info Wiki:
EEVblog Main Web Site:
EEVblog Amazon Store:
Donations:
Projects:
Electronics Info Wiki:
 0:20:27
EEVblog #396 - Bode Plotting on Your Osciloscope
 0:10:41
Active Low Pass Filter Bode Plot Analysis using Siglent SDS2102X Plus Oscilloscope [Part-2]
 0:11:18
EEVblog #778 - Oscilloscope Vertical Confusion
 0:21:22
EEVblog #343 - Spectrum Analyser Tracking Generator Tutorial
 0:06:54
The EEVblog Lab is moving!
 0:10:57
EEVacademy #4 - I²C (I2C) Bit Banging
 0:16:55
30W Class A amplifier - finding max power Bode Plot with Omicron Lab #OmicronLab #BodePlot
 0:20:18
EEVblog #972 - Operating Chips Outside Their Spec
 0:22:00
EEVblog #572 - Cascading Opamps For Increased Bandwidth
 1:14:21
EEVblog #587 - Tektronix MDO3000 Mixed Domain Oscilloscope Teardown
 0:37:44
EEVblog #594 - How To Measure Power Supply Ripple & Noise
 0:24:37
EEVblog #601 - Why Digital Oscilloscopes Appear Noisy
 0:07:39
EEVblog #825 - Your Printer Is Spying On You!
 0:02:01
Test Video
 0:02:01
Test Video
 0:21:44
EEVblog #385 - Amstrad NC100 Notepad Repair
 0:19:37
EEVblog #394 - EEVblog Online Tour
 0:17:00
EEVblog #1213 - The Oscilloscope Interpolation Trap!
 0:46:10
Poor Man’s “Bode Plot” with FY6800 Signal Generator and Oscilloscope
 0:14:31
Bode plot
 0:32:06
EEVblog #386 - Glass Delay Lines Part 2
 0:00:11
Audio Signal on Oscilloscope
 0:33:25
EEVblog #826 - Siglent CEO Eric Qin Visits The EEVblog Lab
 0:43:00
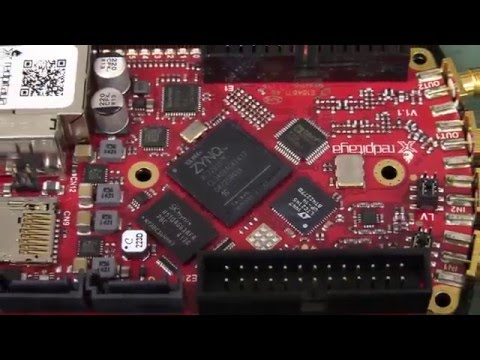
EEVblog #858 - Red Pitaya
Комментарии