filmov
tv
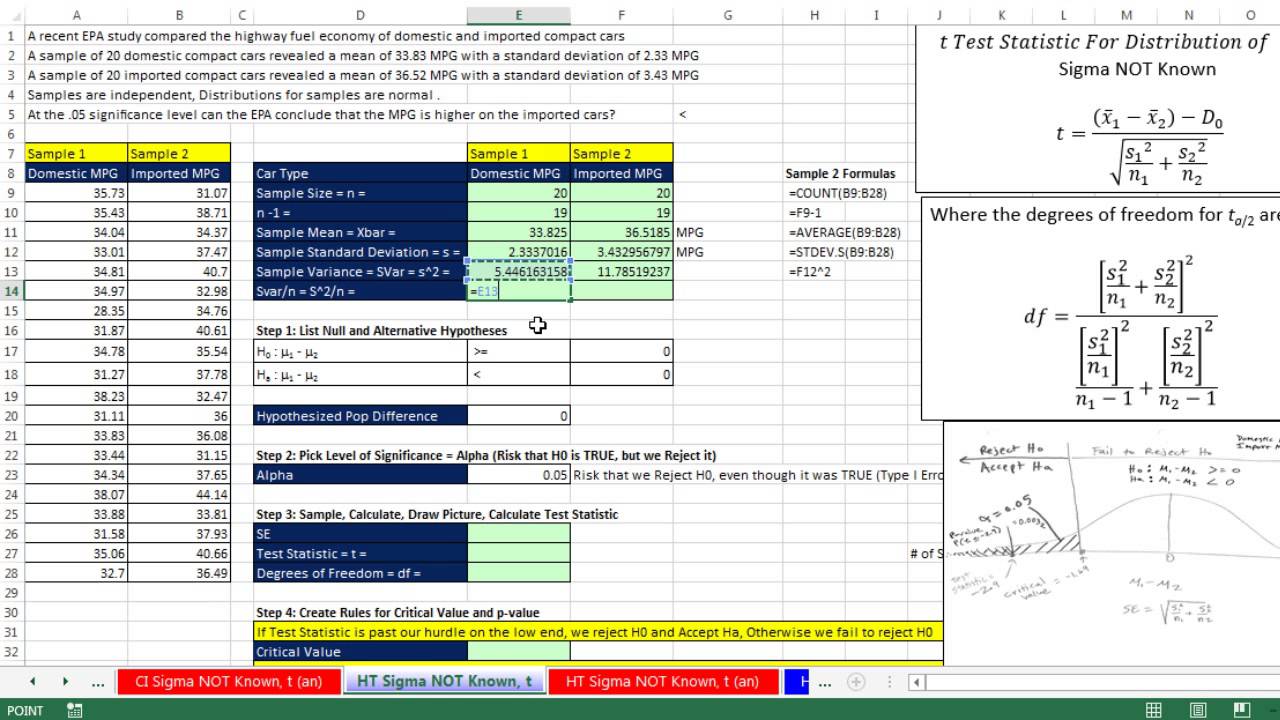
Excel 2013 Statistical Analysis #67: Hypothesis Testing for Population Differences Sigma NOT Known
Показать описание
Topics in this video:
1. (00:12) Into to Hypothesis Testing for Population Differences Sigma NOT Known
2. (02:20) Excel Example for Hypothesis Testing for Population Differences Sigma NOT Known for formulas using functions such as: COUNT, AVERAGE, STDEV.S, SQRT, SUM, T.INV and T.DIST. Also see how to make the complicated Degrees Of Freedom Calculation less complicated using Smart Excel Setup.
3. (14:27) “t-Test: Two-Sample Assuming Unequal Variances” feature in the Data Analysis add-in, in the Analysis group in the Data Ribbon Tab.
 0:17:29
Excel 2013 Statistical Analysis #67: Hypothesis Testing for Population Differences Sigma NOT Known
 0:16:12
Excel 2013 Statistical Analysis #66: Confidence Interval for Population Differences Sigma NOT Known
 0:09:01
Excel 2013 Statistical Analysis #37: Introduction to Continuous Probability Distributions
 0:24:16
Excel 2013 Statistical Analysis #70: Sampling Distribution of Pbar1 – Pbar2, Mean & Standard Err...
 0:09:52
Excel 2013 Statistical Analysis #64: Confidence Interval for Population Differences Sigma Known
 0:20:48
Excel 2013 Statistical Analysis #68: Matched/Paired Samples Population Differences Sigma NOT Known
 2:22:43
Excel 2013 Statistical Analysis #01: Using Excel Efficiently For Statistical Analysis (100 Examples)
 0:09:54
Excel 2013 Statistical Analysis #49: Create Confidence Intervals Sigma Known Z-Score (3 Methods)
 0:18:11
Highline Excel 2013 Class Video 33: Sorting In Excel. Excel Sort (13 Examples)
 0:02:50
Excel 2013 Tutorial#67 Rand bw Function in Excel
 0:16:40
Excel 2013 Statistical Analysis #30: Bayes’ Theorem to Calculate Posterior Probabilities
 0:26:57
Excel 2013 Statistical Analysis #43: Simple Random Sampling in Excel: Process & Theory
 0:15:05
Excel 2013 Statistical Analysis #38: Uniform Probability Distribution
 0:26:20
Excel 2013 Statistical Analysis #63: Sampling Distribution of Xbar1 – Xbar2 & Standard Error
 0:06:33
67 Data Analysis & Using Goal Seek Microsoft Excel 2016 Beginner Course
 0:08:39
Excel 2013 Statistical Analysis #41: Answering Probability Questions With NORM.DIST Function
 0:09:26
67. Manipulating PivotTable data
 0:31:54
Excel 2013 Statistical Analysis #22: Z-Score = # of Standard Deviations, Chebshev’s &Empirical R...
 0:04:31
Excel : Use Sparklines for Quick Analysis of Data
 0:02:51
What's New in Excel 2013 - Quick Analysis
 0:08:50
The Normal Distribution and the 68-95-99.7 Rule (5.2)
 0:05:09
Basic statistics with Excel 2010
 0:07:19
T Test Statistics use for data analysis with Excel 2007 (Six Sigma)
 0:05:55
What's New in Excel 2013 - Timeline Slicers
Комментарии