filmov
tv
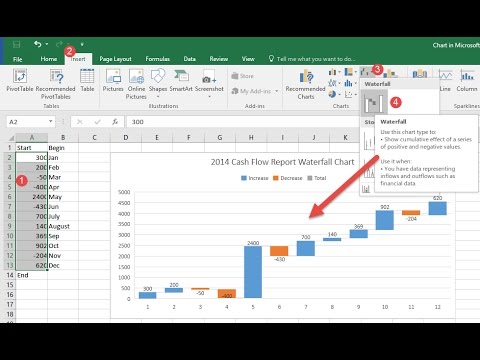
Visualizing Data with Excel Charts Part - 1 | Graphical Representation of Data | Edureka

Показать описание
Advanced MS Excel 2010 course covers all the Excel functions to perform financial, mathematical or statistical calculations such as, DSUM, DCOUNT, Pivot Table, Pivot Chart, Formulas, Functions, and Macros. You will also get to implement an Excel project towards the end of the course.
Objectives:
1) Understand Excel Abilities and its Functions.
2) Explain Data Security, Formatting and Analyzing concepts.
3) Understand the specialized functions like DSUM, DMAX etc.
4) Explain the advanced options of Pivot Table.
5) Summarize data by using Sparklines.
6) Record and play a macro.
7) Edit a macro using VBA Editor.
8) Explain how to manage scenarios.
9) Describe the restrictions and manipulating techniques.
10) Identify the charts Elements
11)Create dynamic Charts by using Pivot Charts
12)Explain the chart Layout and style
13)Describe the process of mapping a simple document
Related Blog :
Edureka is a New Age e-learning platform that provides Instructor-Led Live, Online classes for learners who would
prefer a hassle free and self paced learning environment, accessible from any part of the world.
The topics related to MS Excel 2010 have extensively been covered in our course'Advanced MS Excel 2010'
Call us at US: 1800 275 9730 (toll free) or India: +91-8880862004
 0:24:31
 0:15:06
 1:10:23
 0:14:10
 0:26:35
 0:04:48
 0:00:11
 0:01:01
 0:06:25
 0:50:46
 0:09:19
 0:05:03
 0:01:47
 0:00:27
 0:24:32
 0:00:26
 0:21:06
 0:00:56
 0:03:20
 0:15:52
 0:00:38
 0:00:18
 0:00:20
 0:00:41