filmov
tv
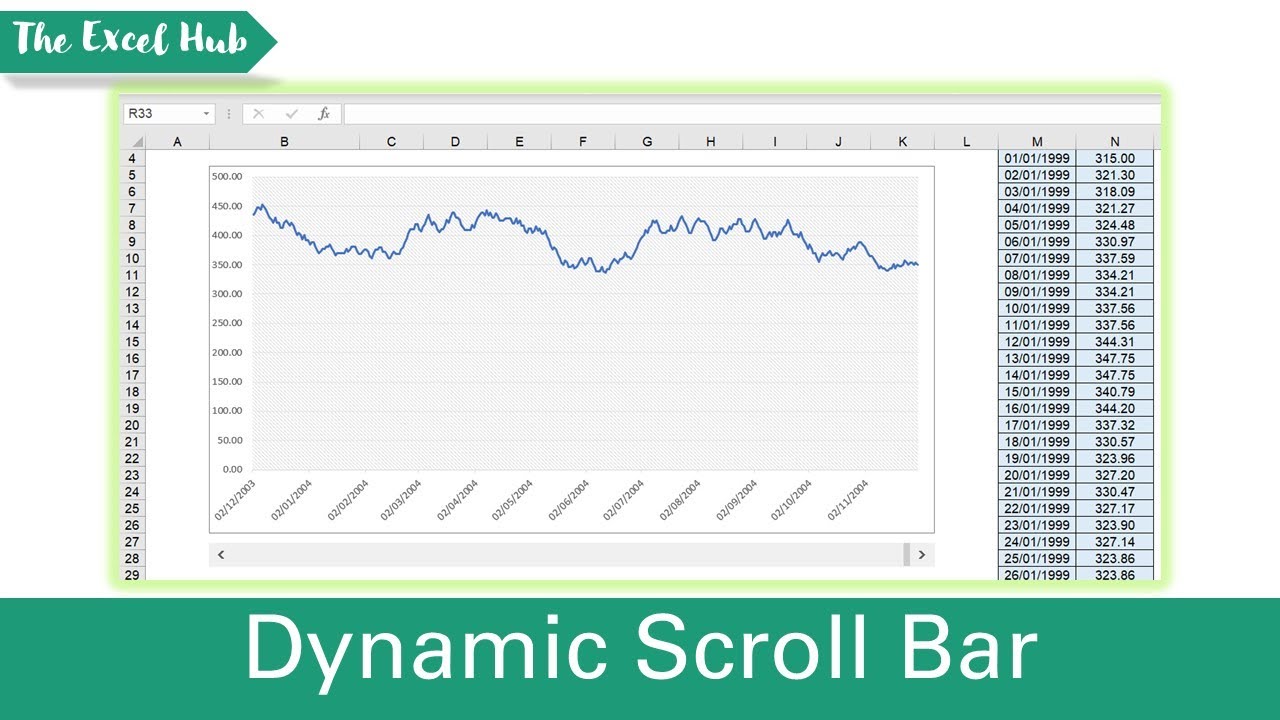
How To Create A Dynamic Chart Using A Scroll Bar In Excel
Показать описание
We cover how to create a dynamic chart with a scroll bar in Excel. In our example, we have the historical daily stock price data for a fictitious company from the start of 1999 to the end of 2004. Due to the sheer amount of data we’d like to display, our line chart currently looks messy. To overcome this, we’ll cover how to insert a scroll bar which allows you to show 1 years worth of data at a time and scroll through the remaining data. We will also create dynamic ranges using the OFFSET function which we will then apply to our chart.
Dynamic Charts That Update Automatically In Excel - Using OFFSET To Create Dynamic Ranges:
Easy Method To Make Dynamic Charts - Format Data Source As A Table (No OFFSET Needed):
Subscribe for weekly Excel tutorials, techniques and examples:
Please share this video with others that may find it useful:
Please comment below if you have any feedback or any suggestions for videos you would like us to upload next!
ABOUT US:
The Excel Hub seeks to enhance your Excel and VBA knowledge by providing value-adding tutorials, techniques and examples in order to help you take your spreadsheet and data analysis skills to the next level.
For any enquiries, please contact:
Overview: (0:00)
Insert scroll bar: (0:38)
Create dynamic ranges: (2:55)
Apply dynamic ranges to chart: (4:40)
 0:18:16
The Basics of Dynamic Content in 15 Minutes
 0:02:11
Dynamic Block For Beginners - AutoCAD
 0:10:15
Effortlessly Create Dynamic Charts in Excel: New Feature Alert!
 0:12:25
How to Create a Dynamic Chart Range in Excel using Dropdown
 0:30:37
How to build Dynamic & Interactive Dashboard in EXCEL with Pivot Tables&Charts | Tutorial Ep...
 0:17:31
Creating dynamic web pages using PHP and MySQL | Part 1 | Coding the front-end
 0:05:33
Dynamic Charts That Update Automatically In Excel - Using OFFSET To Create Dynamic Ranges
 0:14:11
Advanced Excel Tips: How to Create a Dynamic PivotTable Style Report with One Formula
 0:10:58
AutoCAD Create a Block with Scale & Rotate Parameters - Dynamic Block Tips | 2 Minute Tuesday
 0:13:03
Create Dynamic Dropdown Lists in Excel
 0:12:33
How to Create an Excel Interactive Chart with Dynamic Arrays
 0:12:26
Excel Dynamic Charts - Easily Create Dynamic Charts using FILTER & SORT functions
 0:17:34
How to Create a DYNAMIC Map Chart With Drop-Down (works with ANY Excel version)
 0:08:12
Wix Dynamic Pages Tutorial 2024 (For Beginners)
 0:07:01
Dynamic Block For Beginners - AutoCAD
 0:32:13
How to Build a Dynamic Website from Scratch with Wordpress FOR FREE
 0:06:14
How to Create a Dynamic Table on Excel Data Using Power Automate | 2022 Tutorial
 0:04:01
Create a Dynamic Range in Excel... this is different!
 0:09:22
Making a Door Dynamic Block in AutoCAD
 1:11:19
How To Create A Dynamic Appointment Scheduler In Excel [Part 1]
 0:02:56
How to Create Dynamic Forms in WordPress
 0:11:50
Create Your Dynamic Door - AutoCAD
 0:15:32
Create a Dynamic Monthly Calendar in Excel 365 or Online | Dynamic Calendar Excel Formula
 0:07:05
Google Sheets - Create a Dynamic Search Bar with Query and Filter
Комментарии