filmov
tv
What Are And How To Calculate Find Percentiles - Percentile Rank Formula Calculation Explained
Показать описание
In this video we discuss what are percentiles and how to calculate or find percentiles for a given data set. We cover the percentile rank calculation formula, and we also go through an example of how to calculate or find a value for a given percentile.
Transcript/notes
Percentiles
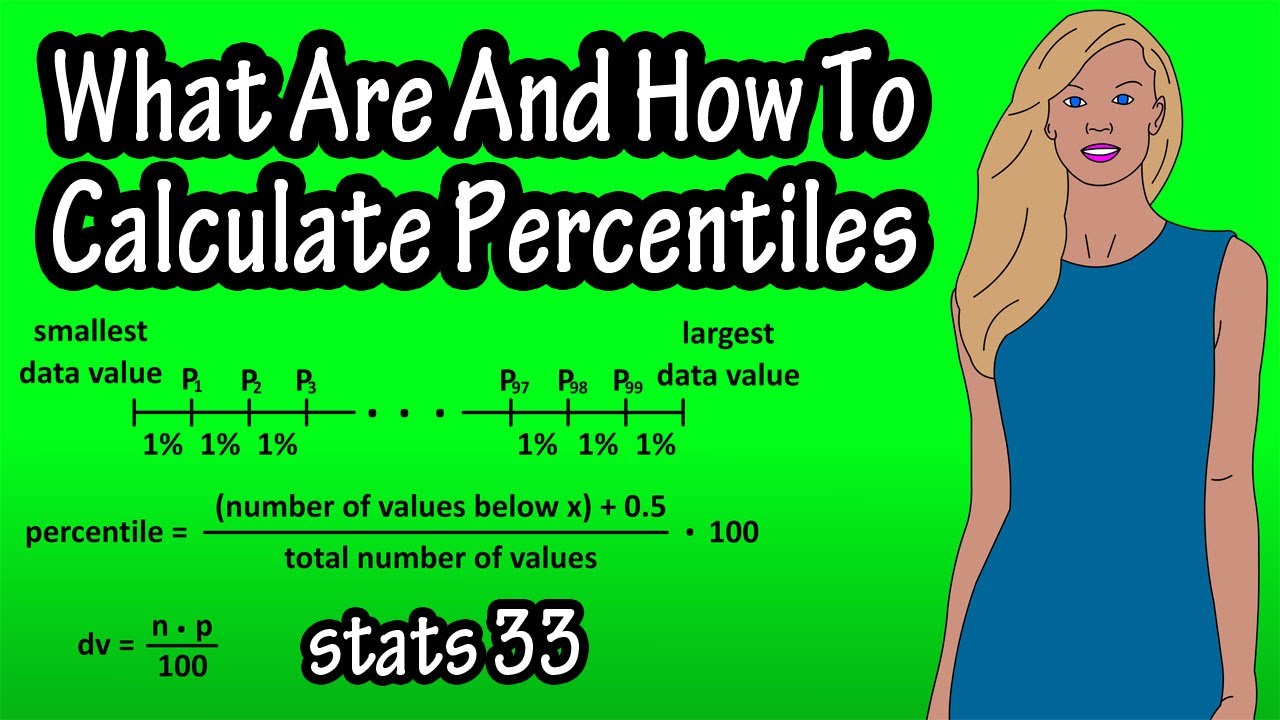
Percentiles are position measures and they can divide a data set into 100 equal groups. They often use the symbol P with a small number. So, you could draw a line and mark each percentile as you see on the screen.
Percentiles are different than percentages, for example, if a student gets 84 questions correct on a 100 question test, she obtained a percentage score of 84, this tells nothing of her position in the data set of students that took the test. However, if she scored in the 84th percentile, then she did better than 84% of the students that took the test.
To find the percentile of a given value, the formula used is percentile = number of given values below x plus 0.5, divided by the total number of values in the data set, times 100.
Here is a data set for subscribers gained for a 1 month period for 20 new youtube channels. Lets say that we wanted to find the percentile rank of for Jackie K’s fashion channel, which is 18. The first thing we do is arrange the data in order of smallest to largest.
Next, we substitute into the formula. So, our x value is 18, and we need to find the number of values in the data set below 18, which is 12. Plug that in, add 0.5, and divide that by 20, the number of values in the data set, and multiply by 100. Doing the calculations, we get percentile = 62.5. So we would say the value of 18, or Jackie K’s channel, is higher than 62.5% of the other data values or channels in this data set.
Now let’s look at finding a data value corresponding to a given percentile. The formula for this is dv = n times p divided by 100. In this formula dv stands for data value, or the location in the data set, n = the number of values in the data set, and p = the given percentile.
And there are two rules for this formula. If the formula results in not a whole number, round up to the next whole number, for instance if the formula produced 3.5, round up to 4, or if the formula results in a whole number, use the halfway value between the resulting whole number and the next whole number. For instance, if the formula produced the number 8, use the halfway value between 8 and 9.
Lets do an example of each of these.
So, working with our previous data set, let’s say we want to find the 80th percentile. We again first arrange the data in order of smallest to largest, then, substituting into the formula we have dv = 20 for n, the number of values in the data set, times 80 for p, the given percentile, divided by 100.
And we get a result of 16. Since 16 is a whole number, we need to use the halfway value between the resulting whole number and the next whole number. So, 16 and 17. We find the 16th value in the data set, which is 23, and the 17th value in the data set, which is 24. Next, we find the halfway value by adding 23 plus 24 and dividing by 2, which is 23.5. So, 23.5 corresponds to the 80th percentile.
Now lets say we wanted to find the 58th percentile. Using our equation we have 20 times 58 divided by 100 which equals 11.6. So, in this case we round up to 12. So, we find the 12th value in the data set, which is 17, so, 17 corresponds to the 58th percentile.
Timestamps
0:00 What Are Percentiles?
0:08 Difference Between Percentiles And Percentage
0:29 Formula For Percentiles
0:44 Example Problem 1
1:28 How To Find Data Value Given A Percentile
2:10 Example Problem 2
Transcript/notes
Percentiles
Percentiles are position measures and they can divide a data set into 100 equal groups. They often use the symbol P with a small number. So, you could draw a line and mark each percentile as you see on the screen.
Percentiles are different than percentages, for example, if a student gets 84 questions correct on a 100 question test, she obtained a percentage score of 84, this tells nothing of her position in the data set of students that took the test. However, if she scored in the 84th percentile, then she did better than 84% of the students that took the test.
To find the percentile of a given value, the formula used is percentile = number of given values below x plus 0.5, divided by the total number of values in the data set, times 100.
Here is a data set for subscribers gained for a 1 month period for 20 new youtube channels. Lets say that we wanted to find the percentile rank of for Jackie K’s fashion channel, which is 18. The first thing we do is arrange the data in order of smallest to largest.
Next, we substitute into the formula. So, our x value is 18, and we need to find the number of values in the data set below 18, which is 12. Plug that in, add 0.5, and divide that by 20, the number of values in the data set, and multiply by 100. Doing the calculations, we get percentile = 62.5. So we would say the value of 18, or Jackie K’s channel, is higher than 62.5% of the other data values or channels in this data set.
Now let’s look at finding a data value corresponding to a given percentile. The formula for this is dv = n times p divided by 100. In this formula dv stands for data value, or the location in the data set, n = the number of values in the data set, and p = the given percentile.
And there are two rules for this formula. If the formula results in not a whole number, round up to the next whole number, for instance if the formula produced 3.5, round up to 4, or if the formula results in a whole number, use the halfway value between the resulting whole number and the next whole number. For instance, if the formula produced the number 8, use the halfway value between 8 and 9.
Lets do an example of each of these.
So, working with our previous data set, let’s say we want to find the 80th percentile. We again first arrange the data in order of smallest to largest, then, substituting into the formula we have dv = 20 for n, the number of values in the data set, times 80 for p, the given percentile, divided by 100.
And we get a result of 16. Since 16 is a whole number, we need to use the halfway value between the resulting whole number and the next whole number. So, 16 and 17. We find the 16th value in the data set, which is 23, and the 17th value in the data set, which is 24. Next, we find the halfway value by adding 23 plus 24 and dividing by 2, which is 23.5. So, 23.5 corresponds to the 80th percentile.
Now lets say we wanted to find the 58th percentile. Using our equation we have 20 times 58 divided by 100 which equals 11.6. So, in this case we round up to 12. So, we find the 12th value in the data set, which is 17, so, 17 corresponds to the 58th percentile.
Timestamps
0:00 What Are Percentiles?
0:08 Difference Between Percentiles And Percentage
0:29 Formula For Percentiles
0:44 Example Problem 1
1:28 How To Find Data Value Given A Percentile
2:10 Example Problem 2
 0:07:01
What Are Neurons and How Do They Work?
 0:05:13
What Are Nerves and How Do They Work? | Operation Ouch | Nugget
 0:05:08
What Are Cookies? And How They Work | Explained for Beginners!
 0:03:39
What are and how to solve number walls?
 0:02:01
What are period cramps and how to deal with them?
 0:01:47
Skin Tags - What they are and how to treat them
 0:10:02
What are Stocks and How do They Work?
 0:11:21
p-values: What they are and how to interpret them
 0:00:26
HTML Input Types Unveiled: What They Are and How to Use Them #webdesign #python #coding
 0:05:23
Prebiotics: What they are and how to eat more
 1:02:21
Motivation and Readiness for Change What They Are and How to Enhance Them | Stop Being Miserable!
 0:05:50
Tomatillos | What they are and how to use them
 0:07:17
What Is A Chord In Music? How To Build Chords and Chord Progressions
 0:08:15
What are Enzymes and How do They Work? - Dr. Berg
 0:07:59
What are Keywords and How to Choose Them? 1.1. SEO Course by Ahrefs
 0:07:04
A Guide To Odds Ratios: What They Are and How To Communicate Them Clearly
 0:09:17
'WHAT' or 'WHICH'? Learn how to choose!
 0:19:59
Transformers for beginners | What are they and how do they work
 0:05:45
Magnets for Kids | What is a magnet, and how does it work?
 0:18:06
What are Shortcuts and How to Build Them - Shortcuts 101
 0:17:19
What are Carbs, Fat, and Protein? And How To Use Each! : 25 Min Phys
 2:34:34
Dr. Marc Brackett: How to Increase Your Emotional Intelligence
 0:05:55
What cookies are and how they work!
 0:11:23
What Are NFTs and How Do They Work?
Комментарии