filmov
tv
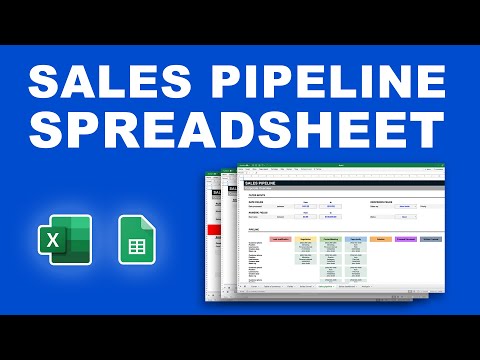
'Sales pipeline management' Excel template with dashboard, stages, forecast, tools, and analysis

Показать описание
Table of Contents:
00:00 - Introduction to the spreadsheet
00:42 - Customize your sales process
02:08 - Manage your funnel
03:02 - Visualize your pipeline
04:00 - Monitor your team
How do you create and manage a sales pipeline? Sales pipelines are valuable for sales reps to manage their leads throughout the entire sales process, from qualification to close.
We’ve created a Sales Pipeline Spreadsheet that lets you customize your process, manage your lead funnel, visualize your pipeline with a kanban visualization, and monitor your team with a dashboard.
You can download and customize this spreadsheet to manage your sales pipeline and follow all of your sales from qualification to close.
First, the user will go the Fields tab to input their sales pipeline preferences.
Input your static inputs, like your sales report name, year, company name, and the event you are tracking - in most cases this will be sales, leads, or however you refer to it internally.
Then, chose the pipeline data formatting, including preferred currency and date formats. Now, two input sections impact the look of the rest of the pipeline: the pipeline display, and the input fields.
The pipeline display indicates what lead information to be displayed on the pipeline. Anything checked in these boxes will appear on the pipeline visualization.
To learn more about this spreadsheet, watch the video in full!
 0:06:30
'Sales pipeline management' Excel template with dashboard, stages, forecast, tools, and an...
 0:00:44
Demo Sales Pipeline Excel Template
 0:22:21
How to manage Sales Pipeline using free Sales Pipeline Tracker Excel template?
 0:13:21
Sales Pipeline Manager Excel Template - Tour of Features
 0:01:07
Sales Funnel Template Excel
 0:12:03
How to create a Sales Funnel template using Excel [in just 10 minutes]
 1:10:16
Excel Dashboard Course #20 - Creating a Sales Pipeline Management Dashboard in Excel
 0:03:44
Sales Pipeline Google Sheets Template | Track your Sales Prospects
 0:00:15
Sales Pipeline Dashboard Template for Excel, Free Download 🡆 http://bit.ly/2zOsc4d
 0:24:21
Sales Pipeline Manager Excel Template - Step by Step Demo
 0:00:15
Sales Pipeline Template for Excel, Free Download 🡆 http://bit.ly/2KEzk40
 0:01:57
Sales Pipeline Template - Demo
 0:00:42
Sales Pipeline Manager (CRM) - Excel Template (Customer Reviews)
 0:03:20
Sales Pipeline Template | Track your Sales Funnel!
 0:01:28
Demo CRM Complete Pipeline Excel Template
 0:06:49
CRM Template | Sales Pipeline, Sales Performance, Calendar and more!
 0:06:35
Sales Tips & Training - How to Build a Sales Pipeline & How it Works Over Time
 0:16:48
Sales Pipeline Management (Best Practices)
 0:11:58
I Built the BEST Sales CRM Using Google Sheets (2023)
 0:07:44
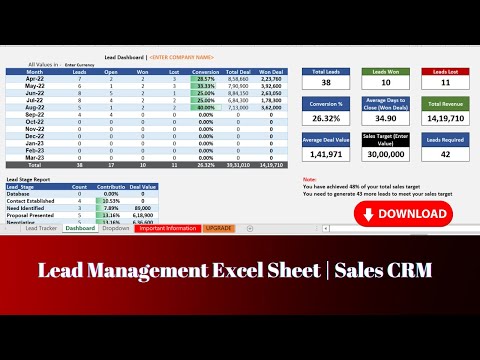
Lead Management Excel Sheet | Download Sales CRM in Excel | Video Tutorial #crm #crmsolutions
 0:03:41
Sales Pipeline Template - Walkthrough
 0:07:25
Lead Tracking Template | Free Lead Tracking Spreadsheet
 0:01:00
Sales Pipeline in Excel | 60 Seconds Tutorial #shorts
 0:00:15
Sales Funnel Template for Excel, Free Download 🡆 http://bit.ly/2KKGDHA
Комментарии