filmov
tv
MACD Scalping: Your Ticket to Fast and Easy Trading Wins!

Показать описание
In this exciting video about MACD scalping, you'll discover a powerful trading strategy that can help you make quick profits in the market. By incorporating the MACD indicator into your scalping approach, you can identify trend changes and momentum shifts with greater accuracy, enabling you to enter and exit trades at just the right time. The video provides step-by-step instructions on how to use the MACD indicator for scalping, including tips on how to set up your charts and how to interpret the signals. With MACD scalping, you can take advantage of short-term price movements and achieve your trading goals with greater ease. Don't miss out on this opportunity to learn about MACD scalping and take your trading skills to the next level!
The trading floor is a new project that I just launched.
World class day trading education and tools
FunderPro
Start your funded account challenge HERE (20% discount with link)
For charts Use Trading View
New Official Telegram Group
TMA OFFICIAL®
Looking for a forex broker?
I use Osprey
regulated broker i recommend is Blueberry markets
Try a $100,000 funded account from OspreyFX
Use coupon code
movingaverage50
To get $50 off
Sign up for a $100,000 FTMO funded account here
Get a free audio book from audible
Links to the indicators
TMA Overlay
TMA Divergence indicator
TMA shop
Get some free stocks from WEBULL
also
Get some free stocks from Public
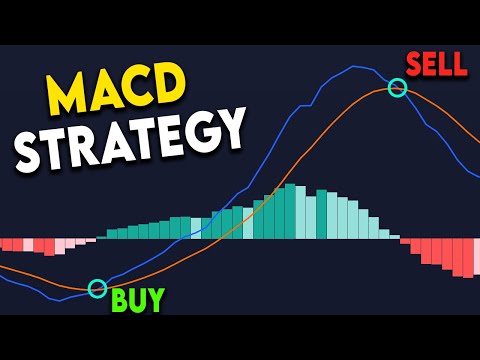
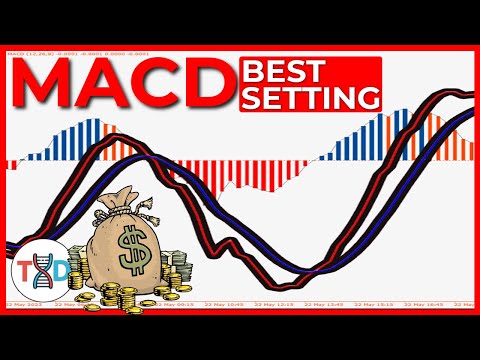
The MACD (Moving Average Convergence Divergence) indicator is a popular technical analysis tool used by traders to identify changes in trend and momentum. It's made up of two lines - the MACD line and the signal line - and a histogram that represents the difference between the two lines. The MACD line is calculated by subtracting the 26-period exponential moving average (EMA) from the 12-period EMA, while the signal line is a 9-period EMA of the MACD line.
One way to use the MACD indicator is to look for crossovers between the MACD and signal lines. When the MACD line crosses above the signal line, it's considered a bullish signal, while a crossover below the signal line is a bearish signal. Traders can use these crossovers to enter or exit trades, depending on their trading strategy.
Another way to use the MACD indicator is to look for divergences between the MACD line and the price action. A bullish divergence occurs when the price is making lower lows, but the MACD is making higher lows. This can be a sign that the trend is about to reverse to the upside.
The MACD indicator can also be used to identify overbought and oversold conditions in the market. When the MACD line moves far away from the signal line, it can be a sign that the market is overbought or oversold, depending on the direction of the trend. Traders can use this information to look for potential reversal or continuation signals.
Scalping is a trading strategy that involves making many trades throughout the day, with the goal of profiting from small price movements. Traders who use scalping typically hold trades for only a few minutes or even seconds, and they aim to capture a small portion of the market's daily volatility.
NOT FINANCIAL ADVICE DISCLAIMER
The information contained here and the resources available for download through this website is not intended as, and shall not be understood or construed as, financial advice. I am not an attorney, accountant or financial advisor, nor am I holding myself out to be, and the information contained on this Website is not a substitute for financial advice from a professional who is aware of the facts and circumstances of your individual situation.
We have done our best to ensure that the information provided here and the resources available for download are accurate and provide valuable information. Regardless of anything to the contrary, nothing available on or through this Website should be understood as a recommendation that you should not consult with a financial professional to address your particular information. The Company expressly recommends that you seek advice from a professional.
*None of this is meant to be construed as investment advice, it's for entertainment purposes only. Links above include affiliate commission or referrals. I'm part of an affiliate network and I receive compensation from partnering websites. The video is accurate as of the posting date but may not be accurate in the future.
 0:05:46
MACD Scalping: Your Ticket to Fast and Easy Trading Wins!
 0:11:59
Best MACD Scalping Strategy for Phone or PC (Trading on Vacation!)
 0:07:06
BEST MACD Trading Strategy [86% Win Rate]
 0:18:07
The MACD Trading Strategy of a Market Wizard
 0:14:21
Best MACD Indicator Settings YOU NEED TO KNOW!!!
 0:01:00
HUGE PROFITS MACD & EMA 5MIN AND 15MIN SCALPING INDICATOR EXPLAINED!
 0:04:16
Best MACD Strategy | 1 minute chart scalping | 85% Accuracy
 0:08:02
MACD Strategy SO GOOD, It's Almost Unfair! Your Ticket to FINANCIAL FREEDOM.
 0:11:21
STOP Using The MACD! Try THIS Indicator Instead
 0:09:22
This Simple MACD Trading Strategy Made $301,000 In 2022!
 0:16:38
MACD secrets and how to find the best trades easily
 0:11:55
INSANE MACD TRADING STRATEGY 99% / You Have Been Using ALL WRONG TRADING TECHNIQUES! This is the WAY
 0:27:05
MACD Indicator Explained: 4 Advanced Strategies
 0:16:43
I Tested The MACD - Does It Actually Make Money?
 0:08:03
I Tested The Best MACD Trading Strategy on Youtube 100 Times ( Must Watch ! )
 0:14:48
MACD Trading Was Hard, Until I Discovered These KEY Clues | MACD Strategies For Beginners
 0:33:53
The MACD Indicator For Beginners [Become An Expert Immediately]
 0:08:29
🔴 Best MACD 'Settings & Combination' for SCALPING, INTRADAY, and SWING Trading
 0:10:23
I Found the Best 15 Minute MACD Strategy Ever!
 0:12:32
I Found an Upgraded Version of The MACD [INSANE]
 0:09:23
99% Winrate RSI, MACD & Stochastic 5 Minute Scalping Strategy BACKTESTED!
 0:04:44
Double MACD Indicator 1 Minute Scalping Trading Strategy
 0:09:35
MACD Indicator Explained
 0:10:45
BEST MACD SCALPING SCALPING STRATEGY - 5min
Комментарии