filmov
tv
Customize Grafana 9.4, 9.5, and 10 | Cheat-sheet for Docker container and Windows

Показать описание
Months of work bundled with deep expertise nicely wrapped into a 7-minute long video revealing simple steps to customize Grafana. In this tutorial, we answered all community questions we collected to this moment.
The latest version of this topic
LINKS FROM THE VIDEO
CHAPTERS
0:00 Intro
0:32 Where to download the file with available Grafana customization commands
0:51 Disclaimer
01:00 Warning 1
01:23 Warning 2
01:33 Warning 3
01:50 Warning 4
2:12 Categories of Grafana customization commands
2:21 Configuration commands (environment variables)
2:51 Using Environment Data Source to display environment variables on a Grafana dashboard
3:13 Cleaning commands
4:09 Visual commands
4:36 Hands-on commands
4:55 Quick demo of how to execute the customization commands for a Docker container
5:39 Customization for Windows
DISCOVER
GET IN TOUCH
#Grafana #GrafanaPlugins #Visualization #visualización
Customize Grafana 9.4, 9.5, and 10 | Cheat-sheet for Docker container and Windows
How to create an alert in Grafana
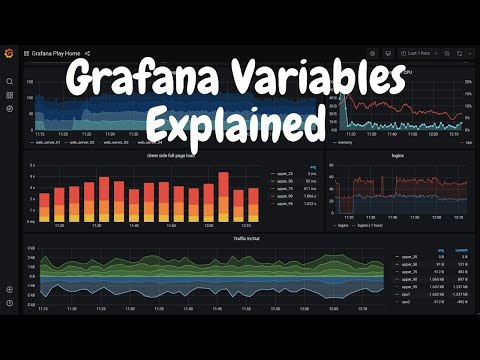
Lesson 17 - Creating Dynamic Grafana Dashboards using Variables in Grafana
Dashboards for DAYS! - How we use Grafana in our #homelab!
Apache ECharts panel for Grafana | How to create modern dashboards in Grafana | ECharts Tutorial
INSANE STATISTICS In Home Assistant With Grafana! - TUTORIAL
Amazing arduino project | Check description to get free money.
Describe your perfect vacation. #philippines #angelescity #expat #travel #filipina #phillipines
Grafana - auf Unraid installieren - Teil 9 - Das MUST-HAVE Monitoring-Tool | Easy Tec
How to build a Prometheus query in Grafana
Senior Programmers vs Junior Developers #shorts
Elon Musk Laughs at the Idea of Getting a PhD... and Explains How to Actually Be Useful!
My Jobs Before I was a Project Manager
The HARDEST part about programming 🤦♂️ #code #programming #technology #tech #software #developer...
Quick and Easy Local SSL Certificates for Your Homelab!
How To Setup A Grafana Dashboard Step By Step
RabbitMQ in 100 Seconds
NEXT LEVEL STATISTICS - Home Assistant InfluxDB and Grafana
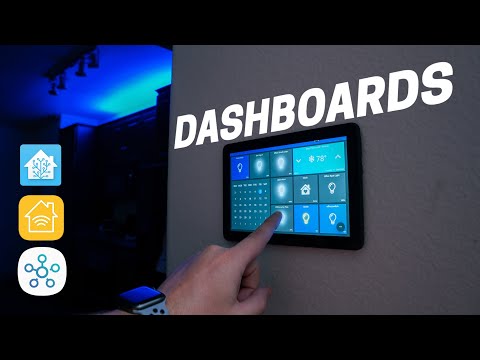
Advanced Smart Home Dashboards Made EASY
frontend tools every developer should have part 9
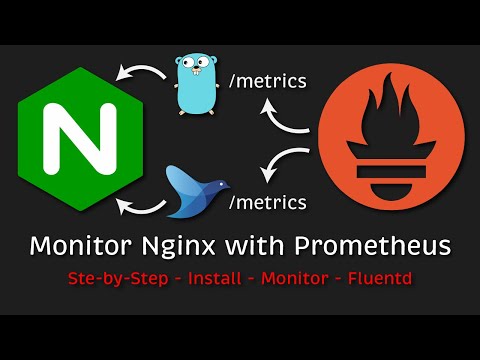
How to Monitor Nginx with Prometheus and Grafana? (Step-by-Step - Install - Monitor - Fluentd)
Create a SLICK Dashboard for your homelab using Grafana, Telegraf and InfluxDB.
9.NodeRed Grafana Influx2 0
GrafanaCON 2023 keynote: Grafana 10, cool new dashboards, and more
Комментарии
 0:07:07
 0:03:47
 0:13:54
 0:09:53
 0:10:19
 0:20:15
 0:00:16
 0:00:16
 0:03:51
 0:01:11
 0:00:34
 0:00:39
 0:00:15
 0:00:28
 0:12:08
 0:21:00
 0:02:31
 0:36:08
 0:09:44
 0:00:21
 0:16:30
 0:10:39
 0:00:32
 1:05:55