filmov
tv
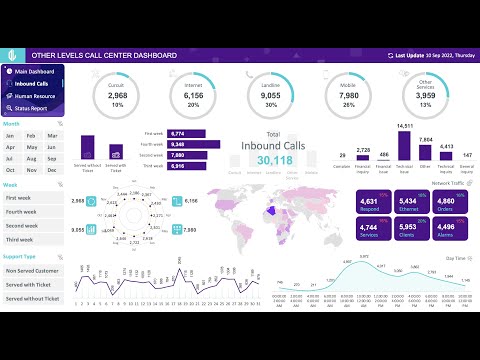
Power BI Call Center Business Performance Dashboard Project | End to End Power BI Dashboard

Показать описание
Power BI Project End to End | Dashboard | Beginners | Power BI Tutorial 2023
Power BI Advance Business Performance Dashboard Tutorial from Start to end where we are looking at Call center Performance Analytics dashboard. Here we'll start the power bi tutorial from scratch where we'll look at how to get the background for dashboard, connecting data, create new measures with the help of DAX code, using parameter for dynamic chart behavior and finally creating dashboards by applying appropriate settings in power bi.
In this training I cover 10 advance dashboards with lot of dax and visualization configuration for standard and professional looking business dashboards.
✅✅DOWNLOAD LINKS✅✅:
Follow me on:
Time Stamps:
0:00 Call center dashboard overview - KPI, Charts and Functionality
3:36 Power BI tutorial Sheets info
4:15 Dataset overview
6:53 Creating Dashboard from scratch
7:34 CSV Data import
8:01 RWFD Datasets Location and overview
9:10 Data Transformation
11:46 Starting Dashboard Development
14:20 - KPI Creation and Formatting and best practice
17:28 Replicating KPIs and creating their new calculations
24:15 Scenario for alternate business calculations from existing data
27:50 Average CSAT calculation, error identification in data
33:30 Creating new workbook to resolve data issue and replicating measures and KPIs
39:50 Creating vertical and horizontal bar charts
43:46 Creating Parameters
44:40 Creating Pie chart and configuring it with parameter for dynamic behavior
48:00 Creating Week number calculation
49:48 Creating Stack bar chart
54:11 Creating Local to Chart Filter experience by modifying filter
55:12 Handling slicer location to bring it above the chart
#endtoend #EndtoEnd #PowerBI #powerbi #beginners #projects #beginnerprojects #completeprojects #datavisualization #dataanalytics #datascience
power bi tutorial power bi project 2023 power bi latest power bi dashboard end to end project 2023 complete project 2023 beginner level project 2023 beginner project 2023 beginner power bi 2023 machine learning data visualization
power bi tutorial ,power bi desktop tutorial ,power bi tutorial for beginners ,power bi desktop ,power bi dashboard ,power bi training ,power bi demo ,power bi for beginners ,power bi dashboard tutorial ,power bi tutorial for beginners excel ,power bi ,tutorial ,desktop ,dashboard ,excel ,microsoft excel ,power bi vs tableau ,tableau vs power bi ,tableau ,mspowerbi ,Power BI Pro ,PowerBIPro ,Avi Singh ,powerbi , call center advance dashboard,
 0:56:55
Power BI Call Center Business Performance Dashboard Project | End to End Power BI Dashboard
 0:47:50
POWER BI DASHBOARD FOR CALL CENTER PERFORMANCE
 0:01:06
Call Center Analytics Project (Microsoft Power BI)
 0:53:53
POWER BI REPORT DESIGN for CALL Center Analysis (Dashboard Design Idea)
 0:00:44
Power BI - Call Centre Dashboard Trailer - Results in a Click
 0:12:01
Power BI- PWC Virtual Internship Task 2 - Call centre Analysis - Forage
 0:01:28
Power BI Dashboard (CALL CENTER)
 1:14:22
Build a Power BI Dashboard in 70 min | Power BI Project | End to End | Beginner to Pro | #powerbi
 0:00:35
Why you probably have a bad manager #theanalyticscareer
 0:14:45
Forage PWC Virtual Internship Task 2 | Call centre Analysis | Power BI
 0:02:05
Call Center Demo in Power BI
 0:01:01
End to End Power BI Call Center Analysis
 0:19:10
Call Center Trend Power BI Dashboard Tutorial
 0:57:25
Power BI Call Center Analytics Project (Part-I)
 0:00:56
Complete Power BI Dashboard for Call Center Performance Project - Step by Step Tutorial - Part 1...
 0:05:30
Call Center Analysis Dashboards Presentation in Microsoft Power BI
 0:16:43
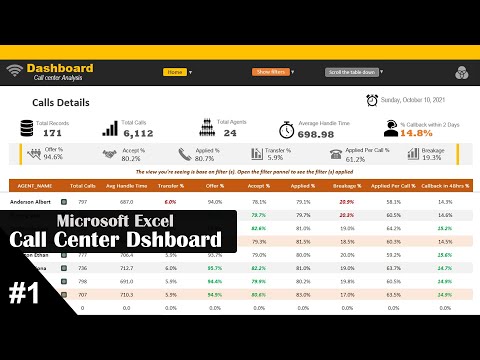
Call Center Performance Dashboard | Microsoft Excel | Video Tutorial #1/2
 0:58:28
Call Center Dashboard In Power BI | End to End Project | Multiple Page Dashboard.
 0:06:14
Power BI Dashboard | Customer Service Agents Dashboard |
 0:21:55
Call Centres Data Reporting - Intro To Power BI Challenge 19
 1:12:48
Customer Satisfaction Analysis | Case Study Using PowerBI
 0:36:22
Inbound Call Center data analysis and interactive dashboard reporting in excel | Video Tutorial
 1:20:31
Advanced Excel Dashboard for Call Center (Step-by-step video tutorial)
 0:31:20
Power BI Dashboard Project for Business | Build Step by Step KPI Dashboard
Комментарии