filmov
tv
Call Center Performance Dashboard | Microsoft Excel | Video Tutorial #1/2

Показать описание
Call Center Performance Dashboard - Comprehensive Excel Analytics
Courses & Playlists:
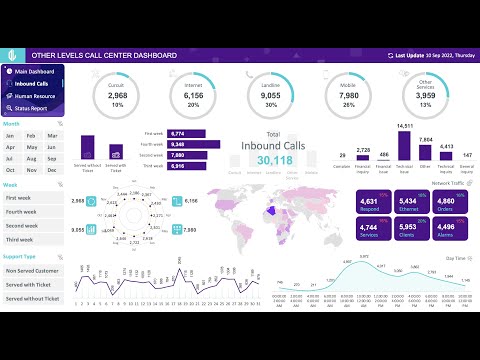
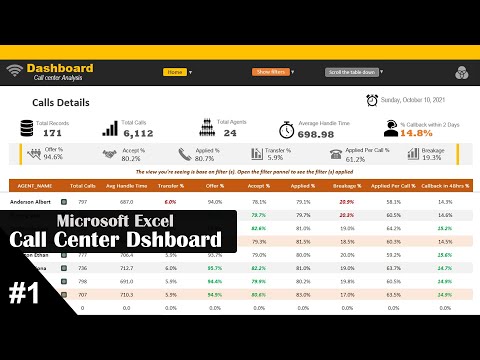
Optimize your customer support operations with the Call Center Performance Dashboard, a versatile and data-driven Excel Dashboard by Other Levels. Designed for managers and analysts, this tool offers a detailed breakdown of call center metrics, enabling you to identify trends, monitor performance, and enhance customer satisfaction.
Comprehensive Call Analysis
The dashboard provides insightful analysis of calls by month, day, and week number, offering a clear view of activity patterns. By categorizing data into support type, service type, issue type, and network type, it allows you to pinpoint areas for improvement. Furthermore, the calls by country feature adds a geographical perspective to your data, making it easier to analyze performance across regions.
Dynamic and Interactive Slicers
With monthly, weekly, and support type slicers, the dashboard enables dynamic filtering, allowing you to customize the displayed data based on specific criteria. This makes it effortless to drill down into the metrics that matter most to your business.
User-Friendly Features
Built on a Full HD Excel Dashboard, it delivers a professional and visually engaging experience. The interface is intuitive, ensuring ease of use for team members at all technical levels. Whether for strategic planning or daily performance tracking, this dashboard is your go-to tool for effective decision-making.
Tailored for Call Center Excellence
The Call Center Performance Dashboard helps you uncover insights that drive operational efficiency and enhance service quality. With features tailored for call center data, it’s an indispensable asset for tracking KPIs and meeting organizational goals.
Upgrade your call center management strategy today with this Excel Dashboard by Other Levels, and turn data into actionable insights.
Key Features
Calls by Month, Day, Week number
Calls Time
Support Type
Service Type
Issue Type
Network Type
Calls by Country
Monthly, Week, and Support Type Slicers
------------------------------------------------------------
Welcome to Other Level’s,
Your go to resource for unlocking the full potential of Microsoft Office.
Whether you're looking to enhance your skills in Excel, Word, PowerPoint, or data analysis, we simplify complex tools with clear, easy to follow tutorials.
Master Microsoft Office with Step by Step Tutorials and Expert Tips!
What sets us apart:
- Comprehensive breakdown of essential formulas, digital designs, and data visualization techniques.
- Straightforward, impactful videos focused on real world business applications.
- We create professional dashboards that help you elevate your productivity and projects.
- No unnecessary jargon just relevant content that helps you master Microsoft tools efficiently.
- Honest, relevant titles and thumbnails that reflect the value we deliver in every video.
Join us and transform the way you work with Microsoft Office.
Every second of our content is designed to help you succeed!
Copyright © 2025 Other Level's. All rights reserved.
"Any illegal reproduction of this content in any form will result in immediate action against the person concerned."
#Excel #Dashboard #call_center_dashboard
Courses & Playlists:
Optimize your customer support operations with the Call Center Performance Dashboard, a versatile and data-driven Excel Dashboard by Other Levels. Designed for managers and analysts, this tool offers a detailed breakdown of call center metrics, enabling you to identify trends, monitor performance, and enhance customer satisfaction.
Comprehensive Call Analysis
The dashboard provides insightful analysis of calls by month, day, and week number, offering a clear view of activity patterns. By categorizing data into support type, service type, issue type, and network type, it allows you to pinpoint areas for improvement. Furthermore, the calls by country feature adds a geographical perspective to your data, making it easier to analyze performance across regions.
Dynamic and Interactive Slicers
With monthly, weekly, and support type slicers, the dashboard enables dynamic filtering, allowing you to customize the displayed data based on specific criteria. This makes it effortless to drill down into the metrics that matter most to your business.
User-Friendly Features
Built on a Full HD Excel Dashboard, it delivers a professional and visually engaging experience. The interface is intuitive, ensuring ease of use for team members at all technical levels. Whether for strategic planning or daily performance tracking, this dashboard is your go-to tool for effective decision-making.
Tailored for Call Center Excellence
The Call Center Performance Dashboard helps you uncover insights that drive operational efficiency and enhance service quality. With features tailored for call center data, it’s an indispensable asset for tracking KPIs and meeting organizational goals.
Upgrade your call center management strategy today with this Excel Dashboard by Other Levels, and turn data into actionable insights.
Key Features
Calls by Month, Day, Week number
Calls Time
Support Type
Service Type
Issue Type
Network Type
Calls by Country
Monthly, Week, and Support Type Slicers
------------------------------------------------------------
Welcome to Other Level’s,
Your go to resource for unlocking the full potential of Microsoft Office.
Whether you're looking to enhance your skills in Excel, Word, PowerPoint, or data analysis, we simplify complex tools with clear, easy to follow tutorials.
Master Microsoft Office with Step by Step Tutorials and Expert Tips!
What sets us apart:
- Comprehensive breakdown of essential formulas, digital designs, and data visualization techniques.
- Straightforward, impactful videos focused on real world business applications.
- We create professional dashboards that help you elevate your productivity and projects.
- No unnecessary jargon just relevant content that helps you master Microsoft tools efficiently.
- Honest, relevant titles and thumbnails that reflect the value we deliver in every video.
Join us and transform the way you work with Microsoft Office.
Every second of our content is designed to help you succeed!
Copyright © 2025 Other Level's. All rights reserved.
"Any illegal reproduction of this content in any form will result in immediate action against the person concerned."
#Excel #Dashboard #call_center_dashboard
 0:16:43
Call Center Performance Dashboard | Microsoft Excel | Video Tutorial #1/2
 1:25:48
Excel Dashboard Course #19 - Call Center Performance Dashboard in Excel
 0:12:59
Call Center Performance Dashboard In Excel
 1:20:31
Advanced Excel Dashboard for Call Center (Step-by-step video tutorial)
 0:56:55
Power BI Call Center Business Performance Dashboard Project | End to End Power BI Dashboard
 0:02:11
Call Center Performance Dashboard
 0:47:50
POWER BI DASHBOARD FOR CALL CENTER PERFORMANCE
 0:00:35
Call Center KPI Dashboard Showing Abandon Percentage Total Queue Entries
 0:48:41
Student Performance Analysis Dashboard - Power BI -
 0:36:22
Inbound Call Center data analysis and interactive dashboard reporting in excel
 0:00:35
Call Center KPI Dashboard Showing Key Metrics Customer Satisfaction
 0:14:36
Boost Your Call Center Efficiency with THIS Dashboard!
 3:30:10
Complete Power BI Dashboard for Call Center Performance Project - Step by Step Tutorial - Part 1...
 0:00:30
Call Center Dashboard and Analytics
 0:00:38
Call Center Demo Dashboard - Excel
 0:01:01
End to End Power BI Call Center Analysis
 0:02:11
Call Center Performance Dashboard
 0:01:03
Call Center Performance Dashboard 2017
 0:27:19
Call Center Performance Dashboard Power BI pwc | Power BI Tutorial for Beginners
 0:04:54
Understanding KPIs in Call Center (5 Key KPIs For Contact Center)
 0:41:46
Call Center Quality Audit Weekly Performance Report in MS Excel
 0:00:35
Call Center KPI Dashboard Showing Total Calls Average Answer Speed Abandon Rate
 0:02:50
Call Center KPI Dashboard | Metrics for Customer Service Agent
 0:12:01
Power BI- PWC Virtual Internship Task 2 - Call centre Analysis - Forage
Комментарии