filmov
tv
Excel Conditional Formatting with Two Criteria or More | Formula AND | Highlight Cells/Rows

Показать описание
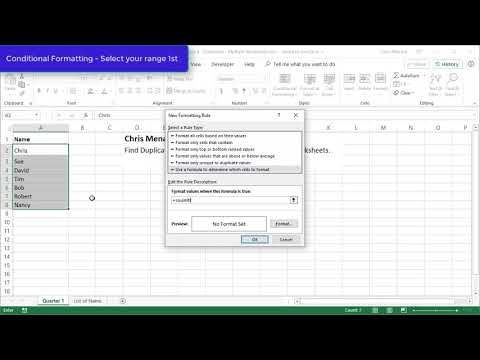
In this Excel video tutorial, we gonna see how to use Excel Conditional Formatting with Two Criteria or More with the Formula AND to Highlight Cells or to highlight Rows whenever a criteria is met.
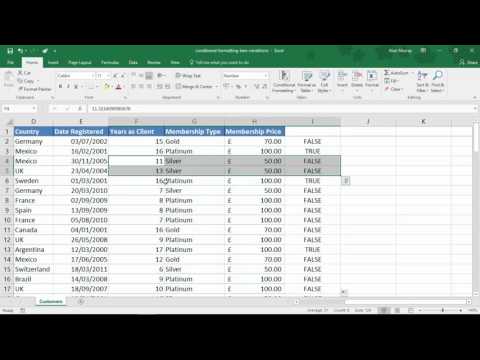
In this practical example of conditional formatting in Excel, I want to highlight several products that I have in stock considering two different criteria. The first criterion is whether the current stock is less than the minimum stock. The second criterion is whether the sales margin is greater than or equal to twenty per cent, 20%.
If both criteria are met, then the product will automatically be highlighted in the chosen color, yellow, red, green, etc.
Conditional Formatting is an excellent tool as it can help us highlight an entire row or highlight an entire column or highlight specific cells, whenever a criteria is met. This Excel tool can help us a lot in analyzing data, to check results, to automate tasks on a daily basis.
Conditional formatting helps you visualize your data by applying different formats such as colors, icons, and data bars based on the values in your cells. This makes it easier to spot trends, patterns, and outliers at a glance.
You can use conditional formatting to highlight important data points or outliers. For example, you can quickly identify sales figures that exceed a certain threshold or highlight cells that contain errors.
Conditional formatting allows you to compare different data sets visually. By applying conditional formatting rules across multiple columns or rows, you can quickly identify similarities and differences between datasets.
By applying gradient fills or color scales, you can visually identify trends and patterns in your data. This can be particularly useful for analyzing time-series data or comparing data across different categories.
Conditional formatting can help you identify and correct errors in your data. For example, you can set up rules to highlight duplicate entries, missing values, or outliers, making it easier to clean and validate your data.
Conditional formatting allows you to create dynamic reports that automatically update based on changes in your data. You can set up rules that adjust formatting dynamically as new data is added or existing data is modified.
By visually highlighting important information and trends, conditional formatting can help you make better-informed decisions more quickly. Whether you're analyzing sales data, financial statements, or project schedules, conditional formatting can provide valuable insights at a glance.
#JopaExcel #Dashboard #Excel
 0:05:23
 0:00:29
 0:06:18
 0:09:40
 0:09:29
 0:03:36
 0:10:37
 0:06:43
 0:02:14
 0:00:27
 0:09:58
 0:05:33
 0:06:24
 0:01:30
 0:01:32
 0:00:36
 0:06:54
 0:00:52
 0:00:10
 0:04:25
 0:00:59
 0:00:16
 0:16:28
 0:05:20