filmov
tv
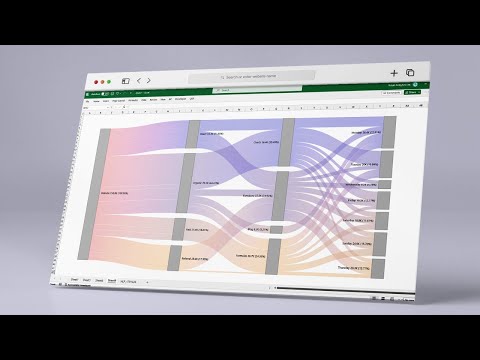
Charticulator #7: Create a Sankey chart without writing any code

Показать описание
Learn how to create a Sankey chart without writing any code using charticulator!
Chapters:
00:00 Intro
00:50 Show the how data is structured
02:00 Add data to charticulator
02:00 Set charticulators CSV regional setting
02:30 Figure out the elements you need for the chart
03:00 Add marks to the chart and configure it
03:20 Group by a field
03:30 Stack by x-axis
03:40 Increase the gap between elements
04:20 Color a shape by a field
04:40 Sort shapes by column
05:00 Add links to the bars
05:45 Conditional format links
06:20 Change the chart title
06:45 Add data text legends
07:50 Add a numerical data legend
08:10 Format numbers in data legends
10:00 Request a feature or report a bug
Done!
 0:10:51
Charticulator #7: Create a Sankey chart without writing any code
 0:26:37
Charticulator Visual IS HERE!!! - Season 1 Episode 7 - Formatting
 0:01:49
How to create a Sankey Diagram in Excel
 0:00:42
How to Create a Sankey Diagram
 0:14:32
Tutorial For Sankey Diagram
 0:00:56
A Sankey Diagram of Microsoft's Income Statement
 0:02:22
How to create a Sankey Diagram in Vysda
 0:06:28
Charticulator #12: How to create a Proportion plot
 0:00:22
How to Display Custom info for Data in Sankey Chart
 0:12:16
Sankey Demo
 0:01:56
Charticulator goes Vegan! - Power BI
 0:05:26
Sankey Chart in Microsoft POWER BI
 0:08:35
Quick Guide to Creating Sankey Charts in Microsoft Power BI!
 0:06:36
Introduction to the Creating area graphs using Charticulator playlist
 0:19:18
How to Make a SANKEY diagram for Free (Step-by-Step)
 0:14:05
Awesome Power BI Visuals With Charticulator
![[R Beginners guide]](https://i.ytimg.com/vi/k-IN6HBhgq4/hqdefault.jpg) 0:06:12
0:06:12
[R Beginners guide] - Sankey diagram from your own datasets: Code Included
 0:03:30
Charticulator #16: How to create a matrix Chart
 0:22:55
Charticulator Visual IS HERE!!! - Season 1 Episode 6 - Group By
 0:03:18
Charticulator #23: How to create an Infographic chart
 0:06:33
Download Template from Charticulator - Live Demo
 0:01:09
How to register a Sankey Diagram in Microsoft Power BI? | Quick Guide | Sankey Chart
 0:16:16
Sankey Diagram in Power BI
 0:08:03
How to use SANKEY Charts in Power BI // Beginners Guide to Power BI in 2020
Комментарии