filmov
tv
IELTS Writing Task 1: Line Graph (1) | Cambridge 18 - Sample Answer + Analysis

Показать описание
Welcome to my IELTS Writing Task 1 series! In this video, I analyze a line graph from the latest IELTS past papers (IELTS Academic 18, Cambridge). Learn how to structure your response and use appropriate vocabulary with a model answer.
⌚ TIMESTAMPS
0:00 introduction
0:09 understand the statement
1:05 understand the data and plan
3:18 paraphrase
4:23 sample
7:50 organization
8:04 cohesion
9:03 vocabulary (lexis)
9:40 grammar
⌚ TIMESTAMPS
0:00 introduction
0:09 understand the statement
1:05 understand the data and plan
3:18 paraphrase
4:23 sample
7:50 organization
8:04 cohesion
9:03 vocabulary (lexis)
9:40 grammar
 0:12:03
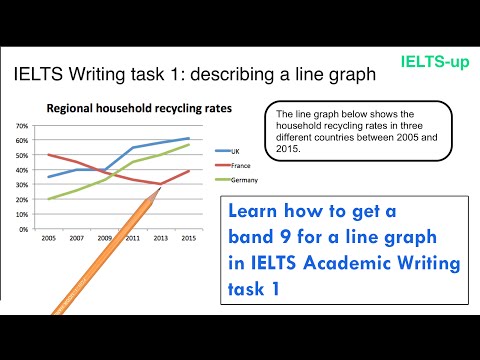
IELTS Writing task 1: line graph
 0:18:06
The KEY to IELTS Academic Writing Task 1: LINE GRAPH
 0:14:00
IELTS Task 1 Line Graphs in 5 Simple Steps
 0:11:00
best way to *compare* lines - ielts writing task 1 line graph
 0:45:43
IELTS Academic Writing Task 1 - Line Graphs
 0:41:31
IELTS Academic Writing Task 1 Vocabulary for Line Graphs
 0:38:43
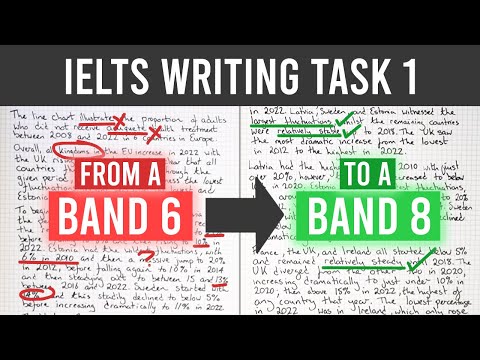
IELTS Task 1 Writing - Transform Band 6 to Band 8
 0:06:31
IELTS Writing task 1: Line graph
 1:25:02
CHỮA ĐỀ WRITING THI THẬT CÙNG GIÁO VIÊN 8.5 IELTS
 0:12:52
E2 IELTS Academic | Writing Task 1 with Jay | Essential Vocabulary
 0:00:30
smart way to describe trends - ielts writing task 1 line graph tips
 0:10:43
IELTS Writing Task 1: Line Graph (1) | Cambridge 18 - Sample Answer + Analysis
 0:00:30
3 verbs to describe trends accurately - task 1 line graph vocabulary
 0:15:06
IELTS-Simon-Writing-Task1-Academic-part-2 Line graphs
 1:18:41
IELTS Writing Task 1 Academic For Beginners
 0:20:50
How To Get Band 9 in IELTS Writing Task 1 Academic
 0:17:20
The Ultimate Guide to IELTS Academic Writing Task 1
 0:16:40
IELTS Academic Writing Task 1 SAMPLE ANSWER | Band 9 | Chart + Table
 0:12:02
do you make *irrelevant* comparisons in a line graph? - ielts writing task 1
 0:09:25
IELTS Writing Task 1 – How To Write an IELTS Line Graph Essay
 0:07:33
IELTS Line Graph: 4 Main Complex Sentence Stuctures
 0:15:47
IELTS Line Graph - 📈📉Writing Task 1 - Sample Answer from a TEACHER
 0:14:54
IELTS WRITING TASK1 ACADEMIC |IELTS 15 TEST 2 line graph | ielts writing task1 tips to get 7 bands
 0:04:56
Do you make these 3 common mistakes when describing an ielts writing task 1 line graph?
Комментарии