filmov
tv
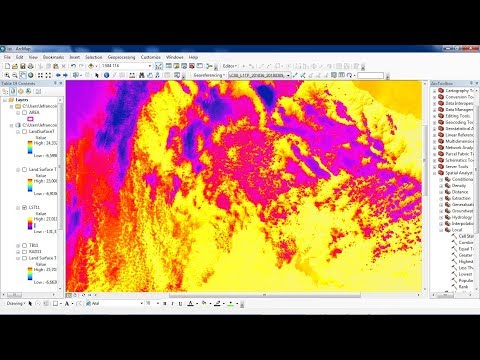
Calculating Land Surface Temperature using Landsat 8 images by ArcGIS || NDVI ||@GeoTech_Studio

Показать описание
LST (Land Surface Temperature) is the earth surface temperature which is directly in contact with the measuring instrument
(usually measured in Kelvin). LST is the surface temperature of the earth’s crust where the heat and radiation from the sun are
absorbed, reflected and refracted. LST changes with a change in climatic condition and other human activities where the exact
prediction becomes challenging. Worldwide urbanization has significantly increased in greenhouse gases and reshaped the
landscape, which has important climatic implications across all scales due to the simultaneous transformation of natural land cover
and introduction of urban materials i.e. anthropogenic surfaces. Ground surveys would permit a highly accurate Land Use Land
Cover (LULC) classification, but they are time-consuming, burdensome and expensive, which highlights remote sensing an
evident and preferred alternative. Identification and characterization of Urban Heat Island (UHI) is typically based on LST that
varies spatially, due to the non-homogeneity of land surface cover and other atmospheric factors. LST is the key factor for
calculating highest and lowest temperature of a particular location. Medium spatial resolution data, such as that from the
LANDSAT and SPOT are suitable for land cover or vegetation mapping at regional local scale. LANDSAT 8 carries two sensors,
i.e., the Operational Land Imager (OLI) and the Thermal Infrared Sensor (TIRS). OLI collects data at a 30m spatial resolution
with eight bands located in the visible and near-infrared and the shortwave infrared regions of the electromagnetic spectrum, and
an additional panchromatic band of 15m spatial resolution. TIRS senses the TIR radiance at a spatial resolution of 100m using two
bands located in the atmospheric window between 10 and 12 μm.
Link to other videos:
Calculating the Criteria Weight by Multiple Criteria Decision Making :
Interpolation:
Thematic Mapping of COVID-19:
Study Area Mapping:
Landuse Land Cover link:
Landslide Assessment video link:
USGS data downloading tutorial video link:
Fire Risk Assessment video link:
Water Delineation Tutorial link:
Georeferencing On ArcMap:
 0:10:46
Estimating Land Surface Temperature Landsat 8 | ArcGIS Tutorial |
 0:26:43
How to calculate land surface temperature from Landsat 8 Satellite Data
 0:17:46
Calculating Land Surface Temperature Using Landsat 8 Imagery In ArcGIS || The GIS Hub || #LST #gis
 0:07:36
Calculating Land Surface Temperature (LST) of Landsat 7 and Landsat 5 | ArcGIS Tutorial
 0:06:39
Calculating Land surface temperature using Landsat 8 Imagery || QGIS Tutorial
 0:05:51
Calculate Land Surface Temperature MODIS | LST MOD11 A2
 0:26:31
Estimating the Land Surface Temperature (LST) using Landsat 8 in ArcGIS
 0:08:30
Land Surface Temperature | Calculate LST in QGIS #qgis #temperature
 0:49:22
Google Earth Engine with Python API for Machine Learning and Deep learning
 0:05:28
Calculating Land Surface Temperature (LST) using R | SEE Lab
 0:15:51
How to calculate Land Surface Temperature from Landsat 9 using ArcGIS II Heatmap II Dr. Jayanta Das
 0:10:17
Calculating Land Surface Temperature (LST) using Satellite imagery
 0:12:31
Land Surface Temperature (#LST) Using Landsat 4-5 or Landsat 7
 0:06:24
Land surface temperature Landsat 8 | la temperature Landsat 8
 0:06:29
How to calculate Land Surface Temperature with Landsat 8 satellite images in ArcMap
 0:00:34
Streamlit web app for calculating Land Surface Temperature (LST)
 0:15:34
How to Calculate Land Surface Temperature using Landsat8 in ArcMap 10.5
 0:05:55
Calculation of Land Surface Temperature LST in QGIS
 0:02:34
Calculate Land Surface Temperature with Model Builder in ArcGIS.
 0:22:46
Calculating Land Surface Temperature Landsat8 by ArcGIS
 0:21:35
Calculating Land Surface Temperature using Landsat 8 images by ArcGIS || NDVI ||@GeoTech_Studio
 0:09:15
Calculate Land Surface Temperature Using Google Earth Engine || Time Series Analysis || MODIS || LST
 0:22:35
How To Calculating Land Surface Temperature Using Landsat 8 In QGIS 3.12.0 'București'
 0:24:18
Calculation of Land Surface Temperature LST of Landsat 8 and 9 in ArcGIS
Комментарии