filmov
tv
How to calculate Land Surface Temperature from Landsat 9 using ArcGIS II Heatmap II Dr. Jayanta Das

Показать описание
In this tutorial I have shown how to calculate LST from Landsat image.
*******************************************************************************************************
International Workshop on An Integrated MCDM approach for Drought Vulnerability Assessments in ArcGIS
Whatsapp: +91 94751 72399
The workshop will be started on 12th February 2012.
After completing this course, you will be efficiently able to process, predict, and validate any data related to hazard, vulnerability, risk, and suitability assessment using the CRITIC, WASPAS, and SAW models.
Live WhatsApp Chatting
e-Certificate will be provided
Publication support from SCOPUS Index Journal
1:1 Sessions with experts
Provide supporting resources like ppt, code, research articles
Access recorded class videos any times
Brochure
*******************************************************************************************************
Enroll Now
Discount Coupon Code: DROUGHT (20% discount)
*******************************************************************************************************
Advances in Geographical Research
Learn research methodology online with courses of Advanced Geospatial technologies, statistical methods, and Machine Learning algorithms.
*******************************************************************************************************
UDEMY Course
Rainfall Indices for MCDM models in ArcGIS: how and Why?
Preparation of 10 important rainfall indices for MCDM models and time series analysis using Excel, ArcGIS and QGIS
Click this link only Rs. 390 or 12.99 USD
*******************************************************************************************************
WhatsApp Group for subscribers:
Group 1
Group 2
***************************************************************************************
Playlist
1. Basics Remote sensing
2. MCDM and ML
3. Arc GIS
4. Free online data download
5. Advanced Excel
SUBSCRIBE to the YouTube channel Dr. Jayanta Das, to get notification about our recent lecture uploads on Advances in Geographical Research.
ALL RIGHTS RESERVED.
#DrJayantaDas
*******************************************************************************************************
International Workshop on An Integrated MCDM approach for Drought Vulnerability Assessments in ArcGIS
Whatsapp: +91 94751 72399
The workshop will be started on 12th February 2012.
After completing this course, you will be efficiently able to process, predict, and validate any data related to hazard, vulnerability, risk, and suitability assessment using the CRITIC, WASPAS, and SAW models.
Live WhatsApp Chatting
e-Certificate will be provided
Publication support from SCOPUS Index Journal
1:1 Sessions with experts
Provide supporting resources like ppt, code, research articles
Access recorded class videos any times
Brochure
*******************************************************************************************************
Enroll Now
Discount Coupon Code: DROUGHT (20% discount)
*******************************************************************************************************
Advances in Geographical Research
Learn research methodology online with courses of Advanced Geospatial technologies, statistical methods, and Machine Learning algorithms.
*******************************************************************************************************
UDEMY Course
Rainfall Indices for MCDM models in ArcGIS: how and Why?
Preparation of 10 important rainfall indices for MCDM models and time series analysis using Excel, ArcGIS and QGIS
Click this link only Rs. 390 or 12.99 USD
*******************************************************************************************************
WhatsApp Group for subscribers:
Group 1
Group 2
***************************************************************************************
Playlist
1. Basics Remote sensing
2. MCDM and ML
3. Arc GIS
4. Free online data download
5. Advanced Excel
SUBSCRIBE to the YouTube channel Dr. Jayanta Das, to get notification about our recent lecture uploads on Advances in Geographical Research.
ALL RIGHTS RESERVED.
#DrJayantaDas
 0:10:31
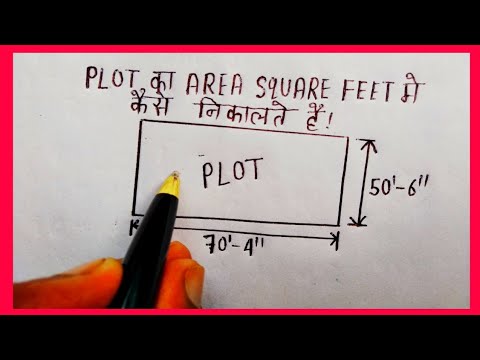
How to calculate land area? #AREA-CALCULATION
 0:26:43
How to calculate land surface temperature from Landsat 8 Satellite Data
 0:02:32
Measure your Land Area using App | How to Calculate Land Area | Land Measurement / Survey App
 0:07:20
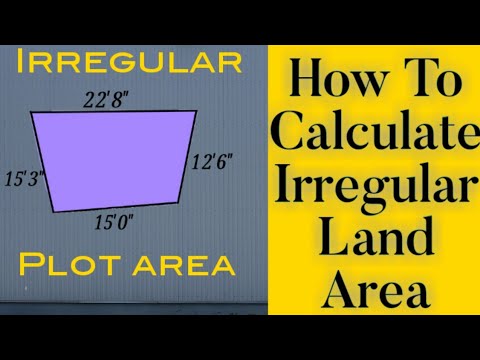
How to Calculate Area of Irregular Land or Plot Step by Step
 0:07:18
How to Calculate land Area from FMB Sketch in Tamil | Sq Feet,Cent,Acres,Ares | Gen Infopedia
 0:06:44
How to Calculate Land Area by Formula?
 0:05:51
Calculate Land Surface Temperature MODIS | LST MOD11 A2
 0:06:04
How To Calculate Irregular Land Area | Irregular Plot Area In Square Feet
 0:17:45
Lesson 5 | Part3| Grading | Feature lines | surface analysis | volume calculation | AutoCAD Civil 3D
 0:10:46
Estimating Land Surface Temperature Landsat 8 | ArcGIS Tutorial |
 0:04:33
How to calculate land area || How to calculate land area in square feet || plot area calculation
 0:26:31
Estimating the Land Surface Temperature (LST) using Landsat 8 in ArcGIS
 0:09:15
Calculate Land Surface Temperature Using Google Earth Engine || Time Series Analysis || MODIS || LST
 0:07:33
How to calculate Irregular land area// Irregular plot area in Square feet
 0:02:34
Calculate Land Surface Temperature with Model Builder in ArcGIS.
 0:17:46
Calculating Land Surface Temperature Using Landsat 8 Imagery In ArcGIS || The GIS Hub || #LST #gis
 0:10:24
How to calculate Land Surface Temperature with Landsat 8 satellite images using Google Earth Engine
 0:26:43
How to calculate land surface temperature from Landsat 8 Satellite Data
 0:05:21
How to Calculate Land Area || Land Area in square feet (Square, Irregular, Rectangular Size of Plot)
 0:10:44
Irregular shape land area calculation | how to calculate land area from fmb sketch online| sqft|cent
 0:06:24
Land surface temperature Landsat 8 | la temperature Landsat 8
 0:15:51
How to calculate Land Surface Temperature from Landsat 9 using ArcGIS II Heatmap II Dr. Jayanta Das
 0:06:39
Calculating Land surface temperature using Landsat 8 Imagery || QGIS Tutorial
 0:06:29
How to calculate Land Surface Temperature with Landsat 8 satellite images in ArcMap
Комментарии