filmov
tv
Likert scale survey data analysis and interpretation on Excel and SPSS

Показать описание
Questionnaire items
Operationalization
Codes and labels
Descriptive statistics
Mean, standard deviation, min, max, and range
Frequencies and percentages
Cronbach alpha reliability
Exploratory factor analysis
Outlier removal
Sociodemographic variables in one table
Custom table function
Z score data transformation
Correlation
Regression
ANOVA
Chart and diagrams
Maslach burnout scale of exhaustion, cynicism and reduced efficacy
Self determination theory
Motivation and its types
Internal motivation
External motivation
Amotivation
The role of motivation on academic burnout
Millennials
Generation Z
Generation Alpha
Data interpretation and report in APA
✨Social media:
Mohamed Benhima, PhD
#questionnaire
 0:13:20
The best way to analyze LIKERT SCALE and INTERPRET the results
 0:06:04
Analyze and chart Agree/Disagree Likert scale survey data using Pivot Table
![Likert-Scale [Simply Explained]](https://i.ytimg.com/vi/Tf_71r1Ve5w/hqdefault.jpg) 0:05:58
0:05:58
Likert-Scale [Simply Explained]
 1:09:35
Likert scale survey data analysis and interpretation on Excel and SPSS
 0:37:10
Likert Scale Data Analysis and Interpretation of Results
 0:07:52
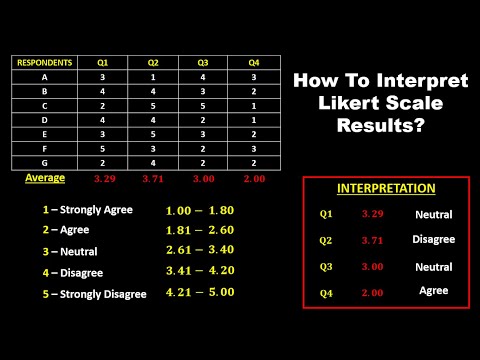
HOW TO INTERPRET LIKERT SCALE RESULTS
 0:11:17
How to analyze data in Excel for Likert Scale Questions | Create graphs for likert scale questions
 0:31:03
SPSS: How to Analyse and Interpret LIKERT-SCALE Questionnaire Using SPSS
 0:10:15
How to Analyze Value-Label Agree/Disagree Likert Scale Survey Data
 0:10:38
Charting Survey Results in Excel (Visualize Employee Satisfaction results)
 0:08:55
How to analyze Likert Scale and interpret the results
 0:03:54
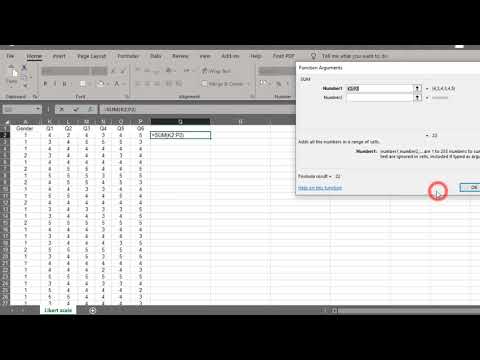
How to analyze Likert Scale using Excel
 0:07:03
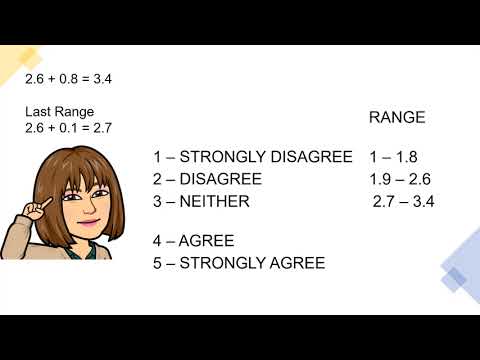
HOW TO INTERPRET THE LIKERT SCALE || 5-POINT LIKERT SCALE
 0:15:19
Likert scale analysis and interpretation for research
 0:04:50
How to import, code and analyse Likert scale from Google Forms into SPSS
 0:20:02
How to analyze Likert-Scale Survey Data Using Excel: Part 1 (Advanced)
 0:10:33
Plotting Likert (agree/disagree) data in Excel
 0:10:44
How to analyse and interpret Likert scale survey (Full SEM in 10 minutes)
 0:22:10
Analyze and chart Agree/Disagree Likert scale survey data in Power Bi
 0:12:43
How to analyse Likert scale questionnaire on Excel: data coding and cleaning
 0:07:03
Grouping Likert scale items for correlation and regression tests with interpretation
 0:03:54
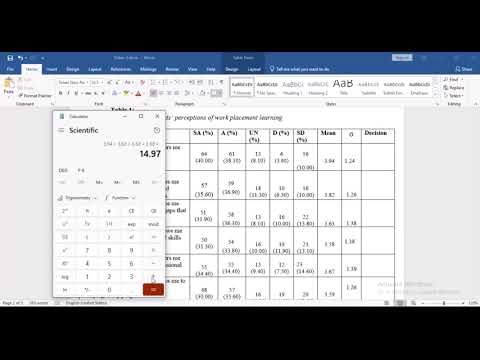
Likert scale analysis and interpretation using descriptive statistics (frequencies and percentages)
 0:06:55
HOW TO INTERPRET 4-POINT LIKERT SCALE RESULT?
 0:29:10
Excel and SPSS: LIKERT-SCALE Data Analysis Using Regression in Excel and SPSS
Комментарии