filmov
tv
What does a sign chart tell us?
Показать описание
After finding the sign chart for your polynomial, first, and second derivatives you may lose sight of what they all represent.
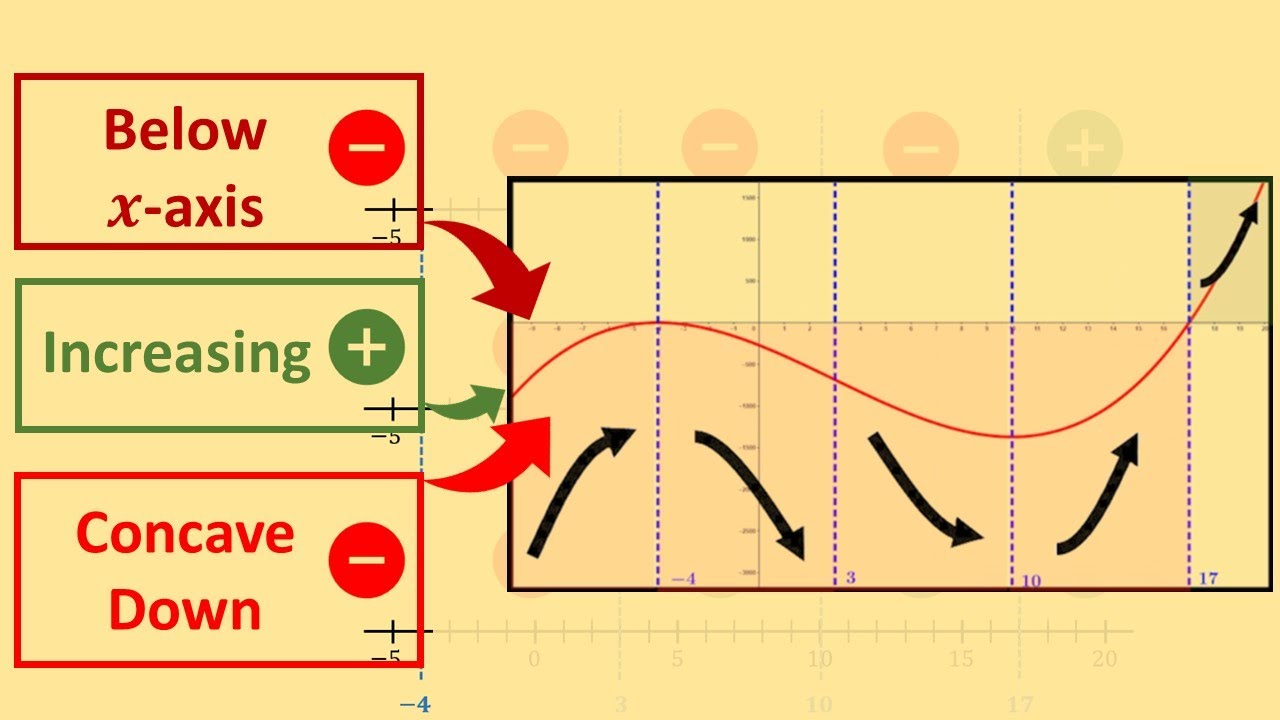
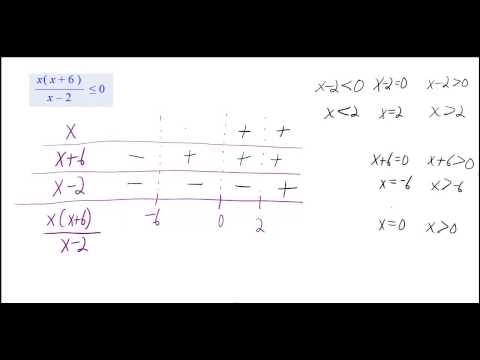
The sign chart of your polynomial will tell you when your function value, f(x), is above (positive on sign chart) or below (negative on sign chart) the x-axis.
The sign chart of your first derivative tells you when your function is increasing (positive on first derivative sign chart) or decreasing (negative on first derivative sign chart).
The sign chart of your second derivative tells you when your function is concave up (positive on second derivative sign chart) or concave down (negative on second derivative sign chart).
0:00 Introduction
0:25 Interpreting the Polynomial Function Sign Chart
1:54 Interpreting the First Derivative Sign Chart
3:28 Interpreting the Second Derivative Sign Chart
4:30 Four possible combinations of First and Second Derivative Sign Chart patterns
4:42 Making sense of all three sign charts together
7:12 Using the template found using the sign charts in unison with graph of polynomial
#polynomial
#polynomialfunctions
#signchart
#joecmath
 0:05:22
Brainstorming: Graphing a Polynomial Using a Sign Chart
 0:11:05
How to Read a Birth Chart.. in Minutes!
 0:15:57
Astrology for Beginners: How to Read a Birth Chart 🌝
 0:29:57
Astrology for Beginners: Read Your Natal Chart in 30 Minutes
 0:05:40
4.2 Sign Chart of Rational Function
 0:29:26
How to Read a Birth Chart: Identifying the Basic Components
 0:15:06
Chart Houses: Understanding House Cusps/Intercepted Signs
 0:12:00
Your Big 3 In Your Astrology Chart - Sun Sign, Moon Sign, Rising Sign
 0:17:42
Options Jam Session: Reviewing All Star Charts options trades - October 10
 0:04:20
Learn Astrology: Cusps in Your Birth Chart (It’s not what you think)
 0:43:57
BEWARE! Proceed with Caution! What does Pluto mean in your Natal Chart!
 0:13:10
PREDICTING YOUR LOVE LIFE BASED ON YOUR NATAL CHART!
 0:14:21
EXPERT Cup And Handle Chart Pattern Trading Strategy (For Pros Only)
 0:12:57
how to make money, based on your birth chart.
 0:06:57
Intercepted Signs & Planets in Your Natal Chart
 0:04:03
Cancer Rising sign/ Ascendant ♋ and Moon chart ruler
 0:54:52
What Does Jupiter Mean in the Natal Chart?
 0:18:04
Intercepted Signs In The Natal Chart: How To Think About Them
 0:14:32
Vedic Astrology || Part 1: How to Read a Chart (Houses, Signs & Planets)
 0:02:52
What are Digital Signatures and How Do They Work?
 0:06:05
The Chinese zodiac, explained | ShaoLan
 0:02:43
LACK OF WATER IN THE NATAL CHART EXPLAINED
 0:06:42
How to Read & Understand a Forex Chart! (For Beginner Forex Traders)
 0:06:41
Rational Inequality via sign chart
Комментарии