filmov
tv
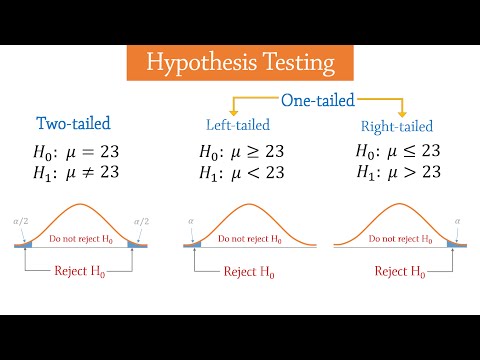
Hypothesis tests on one mean: t test or z test?

Показать описание
A look at at what influences the choice of the t test or z test in one-sample hypothesis tests on the population mean mu. I work through an example of a t test, and compare the p-value of the t test to would have been found had we (incorrectly) used a z test.
 0:04:00
Hypothesis Testing - Introduction
 0:13:34
Hypothesis Testing Problems - Z Test & T Statistics - One & Two Tailed Tests 2
 0:06:58
Hypothesis tests on one mean: t test or z test?
 0:06:18
Hypothesis Tests on One Mean: A t Test Example
 0:07:12
Hypothesis Tests on One Mean: t or z?
 0:06:52
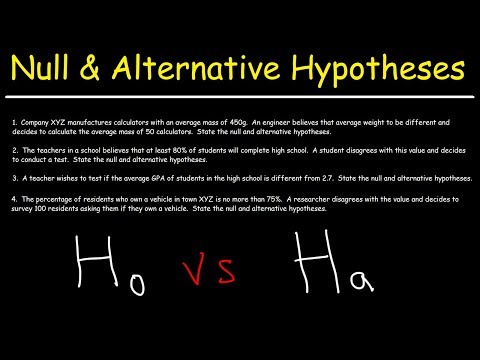
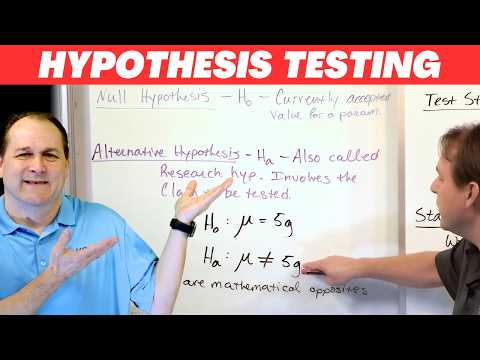
Hypothesis Testing - Null and Alternative Hypotheses
 0:08:07
What is a hypothesis test? A beginner's guide to hypothesis testing!
 0:02:23
Hypothesis Testing: One-tailed t test for mean
 0:51:16
Day-6 Hypothesis Development and Testing
 0:11:13
Z Tests for One Mean: Introduction
 0:11:32
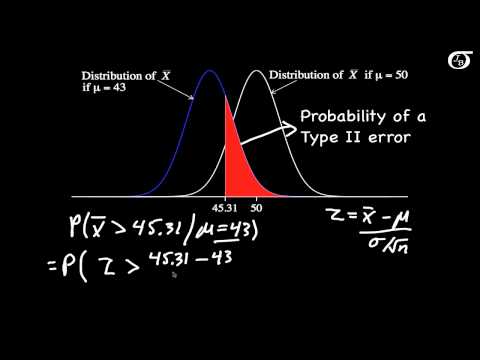
Calculating Power and the Probability of a Type II Error (A One-Tailed Example)
 0:16:01
The Essential Guide To Hypothesis Testing
 0:06:00
Test Statistic For Means and Population Proportions
 0:00:51
Hypothesis Testing 🔥 Explained in 60 Seconds
 0:12:42
Hypothesis testing #1: Basics (no maths!)
 0:14:41
Hypothesis Testing and The Null Hypothesis, Clearly Explained!!!
 0:01:59
Statistical Significance, the Null Hypothesis and P-Values Defined & Explained in One Minute
 0:09:38
Hyp testing #3: Testing for μ when σ is unknown
 0:23:41
Intro to Hypothesis Testing in Statistics - Hypothesis Testing Statistics Problems & Examples
 0:06:25
Simple hypothesis testing | Probability and Statistics | Khan Academy
 0:16:39
Hypothesis Testing in Statistics - Means w/ Small Samples
 0:16:03
Hyp testing #2: Testing for μ when σ is known.
 0:05:36
The Relationship Between Confidence Intervals and Hypothesis Tests
 0:07:58
P-values and significance tests | AP Statistics | Khan Academy
Комментарии