filmov
tv
Excel 2013 Statistical Analysis #51: Confidence Intervals for Pbar Sample Proportion

Показать описание
Topics in this video:
1. (00:01) Intro to formula to build Confidence Interval for Sample Proportion (Pbar) using Z and Normal Distribution
2. (01:11) Example in Excel: For Employee Survey response to Excel question. We create a Confidence Interval for a Sample Proportion (Pbar) using Z and the Normal Curve. NORM.S.INV and COUNTIF functions.
3. (07:38) Example in Excel: Customer Survey response to new product. We create a Confidence Interval for a Sample Proportion (Pbar) using Z and the Normal Curve. NORM.S.INV and COUNTIF functions.
 0:11:14
Excel 2013 Statistical Analysis #51: Confidence Intervals for Pbar Sample Proportion
 0:07:01
Excel 2013 Statistical Analysis #52: Determine Sample Size for Sample Mean & Sample Proportion
 0:12:17
Excel 2013 Statistical Analysis #54: 1 Tail Left Mean Hypothesis Z Test: P-value & Critical Valu...
 0:41:36
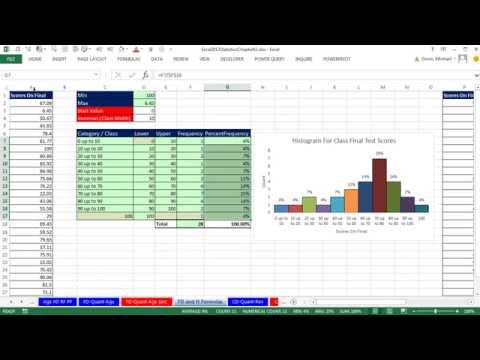
Excel 2013 Statistical Analysis #8: Frequency Distributions, Histograms, Skew, Quantitative Variable
 0:09:53
Excel 2013 Statistical Analysis #61: Hypothesis Test for Proportions using p-value or Critical Value
 0:06:08
Use Excel 2016 to make Frequency distribution and Histogram for quantitative data
 0:20:15
Excel 2013 Statistical Analysis #50: t Distribution Confidence Intervals Sigma NOT Known 3 Examples
 0:01:21
Mastering Excel 2013 Lesson 51 Filtering Data 47
 2:22:43
Excel 2013 Statistical Analysis #01: Using Excel Efficiently For Statistical Analysis (100 Examples)
 0:24:08
Excel 2013 Statistical Analysis #39: Probabilities for Normal (Bell) Probability Distribution
 0:28:04
Excel 2013 Statistical Analysis #71: Inference About Difference Between 2 Pop. Proportions Z Method
 0:22:06
Office 2013 Class #51: Fix Word 2013 Mail Merge Number Format Problem: Excel & Access Data Sourc...
 0:38:09
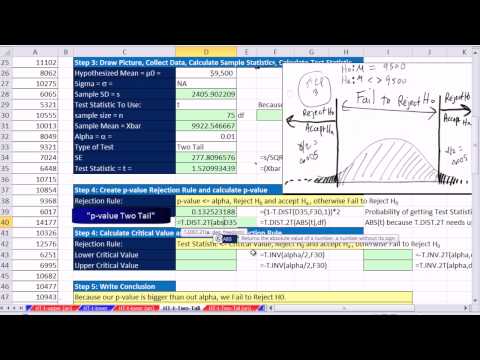
Excel 2013 Statistical Analysis #53: 5 Steps Hypothesis Testing: P-value & Critical Value Method...
 0:33:16
Highline Excel 2013 Class Video 51: Recorded Macro Basics, including Absolute & Relative Referen...
 0:10:23
Excel 2013 Statistical Analysis #59: 2 Tail Mean Hypothesis T Test: P-value & Critical Value
 0:17:29
Excel 2013 Statistical Analysis #67: Hypothesis Testing for Population Differences Sigma NOT Known
 0:09:09
Excel 2013 Statistical Analysis #58: 1 Tail Left T Score Mean Hypothesis Test P-value Critical Value
 0:16:12
Excel 2013 Statistical Analysis #66: Confidence Interval for Population Differences Sigma NOT Known
 0:31:07
Excel 2013 Statistical Analysis #25: Probability Basics: Sample Points, Events & Event Probabili...
 0:14:02
Excel 2013 Statistical Analysis #48: Introduction to Confidence Intervals
 0:12:35
Highline Excel 2013 Class Video 46: Statistics: Histogram Formulas & Chart in Excel 2013
 0:12:15
Excel 2013 Statistical Analysis #55: 2 Tail Z Score Mean Hypothesis Testing P-value Critical Value
 0:09:52
Excel 2013 Statistical Analysis #64: Confidence Interval for Population Differences Sigma Known
 0:09:54
Excel 2013 Statistical Analysis #49: Create Confidence Intervals Sigma Known Z-Score (3 Methods)
Комментарии