filmov
tv
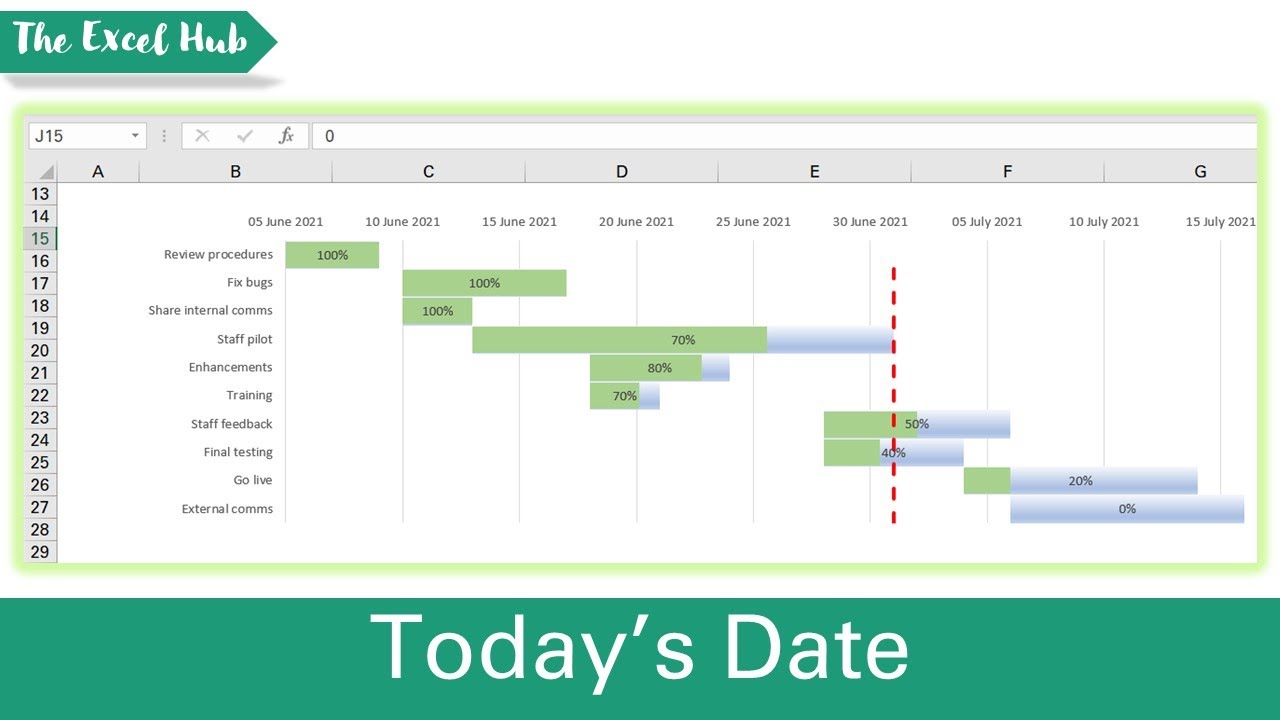
Gantt Chart – Add Vertical Line To Represent Today’s Date In Excel
Показать описание
We cover how to add a vertical line to show today’s date in a Gantt chart in Excel. In our example, we have a Gantt chart which shows our progress towards achieving certain tasks. What we want to do is have a line showing today’s date so that we know where in the project plan we currently are. To do this, we'll need to add a series representing today's date, formatted as a scatter chart.
How To Create A Gantt Chart With A Progress Bar To Show Percentage Completion Of Tasks In Excel:
Excel Charts Playlist:
Subscribe for weekly Excel tutorials, techniques and examples:
Please share this video with others that may find it useful:
Please comment below if you have any feedback or any suggestions for videos you would like us to upload next!
ABOUT US:
The Excel Hub seeks to enhance your Excel and VBA knowledge by providing value-adding tutorials, techniques and examples in order to help you take your spreadsheet and data analysis skills to the next level.
For any enquiries, please contact:
Overview: (0:00)
Assign co-ordinates: (0:35)
Add Vertical Line: (1:20)
Impact of co-ordinates: (3:03)
 0:04:48
Gantt Chart – Add Vertical Line To Represent Today’s Date In Excel
 0:15:59
How to Make the BEST Gantt Chart in Excel (looks like Microsoft Project!)
 0:02:08
How to Add Vertical Line In #Excel Graph/Chart
 0:00:22
How to add vertical gridlines to chart in Excel
 0:09:36
TECH-005 - Create a quick and simple Time Line (Gantt Chart) in Excel
 0:13:15
Visualize Projects: Excel Gantt Chart Tutorial!
 0:02:11
How can I add vertical gridlines to Visio Gantt Chart?
 0:02:43
Gantt chart
 0:02:36
Gantt Chart Task Lines: Adding and Removing them automatically
 0:01:29
How to | Highlight TODAY! | Timeline / Gantt | Google Sheets / Excel
 0:04:54
How to Create a Vertical Timeline in Excel
 0:00:27
Axes options in Excel
 0:02:22
Show the Gridlines on Gantt Chart - MS Project
 0:07:52
7 minutes trick to Bar Chart or Gantt Chart in Excel | Smart Project Management
 0:03:08
Excel Chart Tip: Marking the current date on a line chart
 0:05:05
Create a Gantt Chart in Excel That Actually Works!
 0:06:20
How Can I Add a Vertical Line to an Excel Graph?
 0:06:37
How to create a Gantt Chart in Excel
 0:09:22
Create a Chart with a Vertical Line to Separate Pre and Post Date Activity
 0:03:06
Add a DATELINE or MARKER BAR for CURRENT DATE or TODAY's DATE in Google Sheets
 0:00:28
Fully functional gantt chart in Excel | officedunia
 0:01:57
How to add a milestone in Microsoft Project
 0:08:30
How to make Gantt chart in R?
 0:10:41
How to Create a Gantt Chart in Google Sheets
Комментарии