filmov
tv
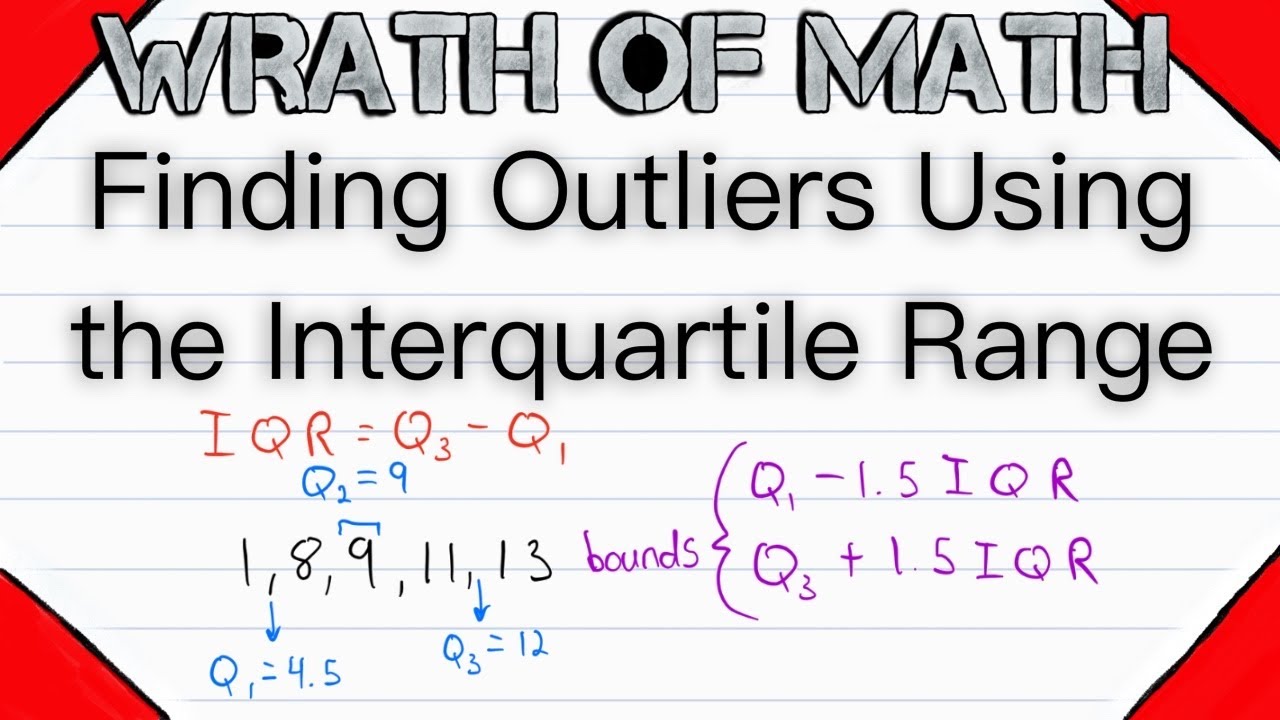
Finding Outliers using Interquartile Range | Statistics, IQR, Quartiles
Показать описание
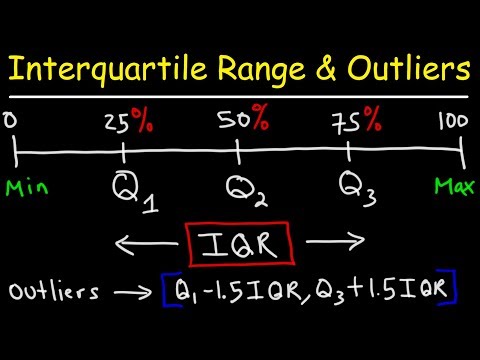
How do we find outliers of a data set using the interquartile range? This is done using a simple rule, any value less than Q1-1.5*IQR is an outlier, and any value greater than Q3+1.5*IQR is an outlier. We'll go through the step by step process of finding outliers using IQR in today's video statistics lesson! #Statistics #APStats
Remember that a data value being an outlier doesn't suggest we should discard it; it means we should take a close look at it and decide what to do in our statistical analysis. We may want to discard it, it may be an error/typo in which case we would want to correct it if possible, or it may be a key to understanding the situation being analyzed!
Also, remember that if this rule doesn't identify a value as an outlier - that doesn't mean YOU don't think it is an outlier. If a data set is sufficiently small you can look at each value individually and determine what values merit special attention. This rule for outliers is particularly useful for large data sets; but we apply it to small data sets so we can practice applying it by hand and seeing it in action!
I hope you find this video helpful, and be sure to ask any questions down in the comments!
********************************************************************
The outro music is by a favorite musician of mine named Vallow, who, upon my request, kindly gave me permission to use his music in my outros. I usually put my own music in the outros, but I love Vallow's music, and wanted to share it with those of you watching. Please check out all of his wonderful work.
********************************************************************
+WRATH OF MATH+
Follow Wrath of Math on...
 0:12:33
How To Find The Interquartile Range & any Outliers - Descriptive Statistics
 0:02:38
Determining an Outlier Using the 1.5 IQR Rule
 0:05:57
How to Find Interquartile Range and Outliers | Statistics Exercises
 0:03:44
Finding Outliers & Modified Boxplots 1.5(IQR) Rule
 0:09:35
Finding Outliers using Interquartile Range | Statistics, IQR, Quartiles
 0:00:55
Finding the Outliers of a Data Set Using the Interquartile Range (IQR) #Shorts #statistics #math
 0:08:02
Outlier detection and removal using IQR | Feature engineering tutorial python # 4
 0:06:52
How to Use Interquartile Range to Identify Outliers
 0:03:53
What Are And How To Calculate Quartiles, The Interquartile Range, IQR, And Outliers Explained
 0:06:05
Finding outliers using inter Quartile range Google Sheets
 0:10:35
A-Level Maths: L4-01 [Outliers: Using the Quartiles and Interquartile Range]
 0:03:23
How to Find the Interquartile Range of a Set of Data | Statistics
 0:04:23
Outliers - Box and Whisker Plot (1.5 IQR)
 0:04:13
Interquartile Range Statistics & Detecting Outliers (Introduction)
 0:00:59
Detecting outliers 📊 #outliers #datascience #boxplot #shorts
 0:04:45
Statistics - How to find outliers
 0:05:01
How Do You Tell If a Number is an Outlier? | Using IQR to find Outliers for a Modified Boxplot
 0:07:14
Find the Interquartile Range with Even Data Set | Statistics
 0:07:10
#GeeklyHuub What is Interquartile Range? How to Find IQR and Identify Outliers
 0:19:54
Simple Approach to Find Quartiles Interquartile Range and Outliers Statistics Measure of Dispersion
 0:09:31
Finding outliers in a dataset IQR method
 0:05:21
Inter Quartile Range (IQR) based Outlier or anomaly detection in machine learning by Mahesh Huddar
 0:09:19
Detecting Outliers with the Interquartile Range (IQR) and Boxplot using SPSS
 0:07:34
Interquartile Range (IQR) | Math with Mr. J
Комментарии