filmov
tv
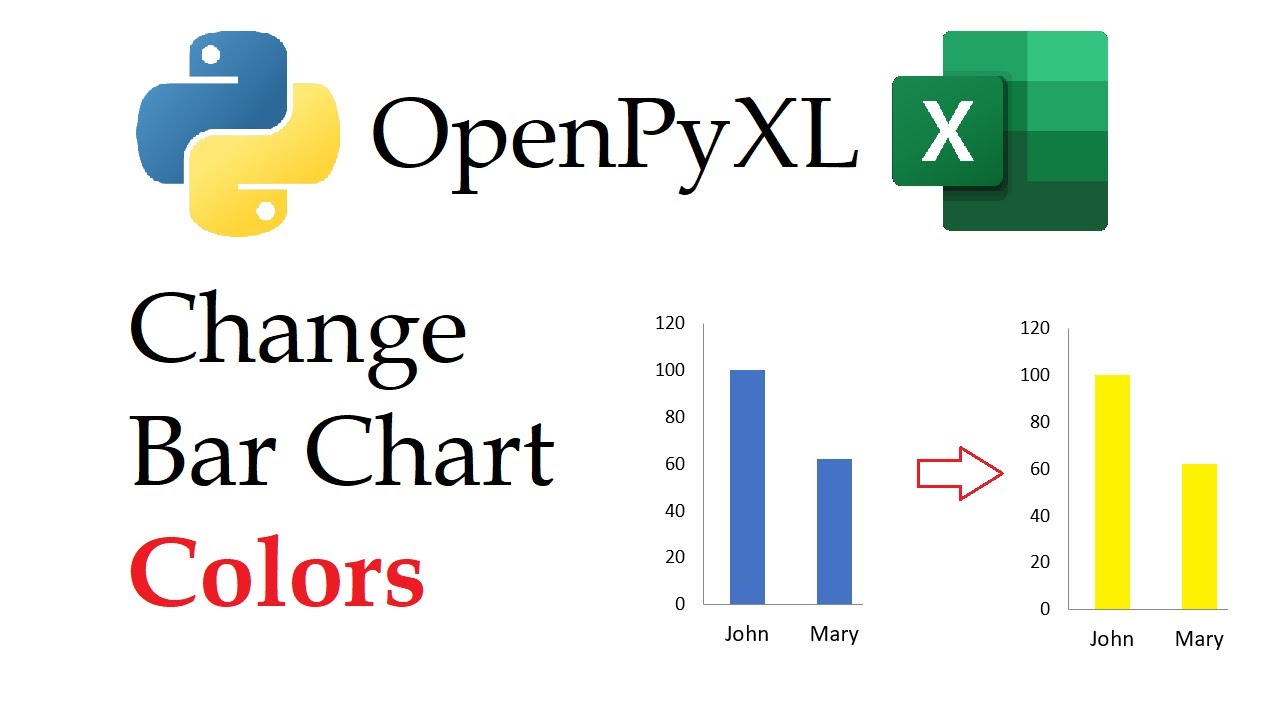
OpenPyXL - Changing Bar Chart Colors in Excel Workbooks with Python | Data Automation
Показать описание
This video reviews how to change the colors of a bar chart in an excel workbook using the Python library Openpyxl. I use Anaconda's Jupyter Lab interface.
😄 Please consider supporting this channel and making this content possible:
00:00 :: Intro and Workbook Review
00:30 :: Creating a Bar Chart overview
01:10 :: Assigning a new color
02:23 :: Overview
#PythonExcelTutorial #openpyxl #data #DataAutomation #python #pythontutorial #excel #pythonautomation #pythonprogramming #jupyterlab #barcharts #barchart #columnchart
 0:02:48
OpenPyXL - Changing Bar Chart Colors in Excel Workbooks with Python | Data Automation
 0:06:16
ASMR Programing - How To Create a Bar Chart in Excel with Python and OpenPyXL - No Talking
 0:21:11
PYTHON - OPENPYXL 2 : Gráficas tipo barras, 2D y 3D sombreada en un archivo excel desde PYTHON
 0:05:55
OpenPyXL - Creating Line Charts in Excel Workbooks with Python | Data Automation
 0:05:08
Intro To Charts and Graphs - Bar Charts, Line Charts, Area Charts, ScatterCharts
 0:04:38
Excel 2D Area Chart using Openpyxl
 0:10:16
How To Easily Insert Python Charts Into Excel
 0:08:43
Openpyxl(Python with Excel)- adding chart to Excel file
 0:25:21
Openpyxl library to create Excel file and add list, dictionary, formats, formulas, charts and images
 0:44:17
CS384 Aug Nov 2021 Session Lecture 14 OpenPYXL Chart Formulas OS Library Basic
 0:04:19
Python openpyxl Charts
 0:12:51
Python Excel 3/5 : Auto creation of charts in excel using python openpyxl
 0:13:42
Openpyxl How to change cell color, Openpyxl Change Text Color Font Color, Openpyxl Apply Border
 0:22:08
Automate Excel Reporting with Python! Combine Workbooks and Add Charts with Pandas and Openpyxl
 0:10:38
Pandas Matplotlib Tutorial | Making Bar Graph Of Excel Files Using Python
 0:12:27
Python and Excel programming with OpenPyXL
 0:40:20
Creating and customizing multiple bars in Bar chart| changing color,width of bars | By Gopal Krishna
 0:16:06
Python Excel Automation #1 - Consolidate Excel Workbooks, Python Pivot Tables, and Excel Charts
 0:25:40
Python Tutorial: Bar Chart Plotting in Python
 0:03:14
excel dashboard using python
 0:03:57
How to Apply Pattern Fill/Background Color in Excel using Python. Openpyxl Tutorial #6
 0:01:57
How to Group Dates on the X-Axis Using Openpyxl?
 0:12:25
How to create bar chart in python in urdu/hindi | 11
 0:05:17
Openpyxl load_workbook Function - Load Excel File in Python Openpyxl
Комментарии