filmov
tv
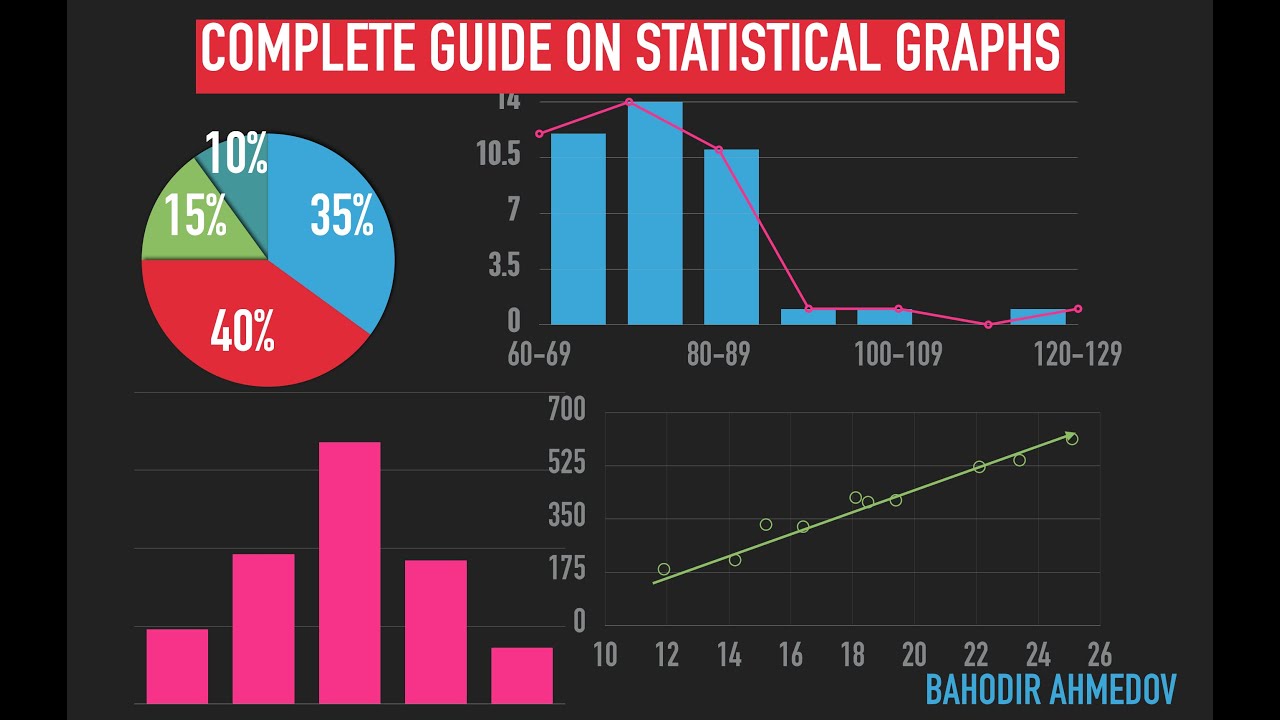
Graphs: histogram, scatter plot, polygon, stemplot, ogive, pie, bar chart, dot plot.
Показать описание
Complete description of statistical graphs with examples and applications into the different data sets. We use the graphs depending on our purposes and data sets.
Intro - (0:00)
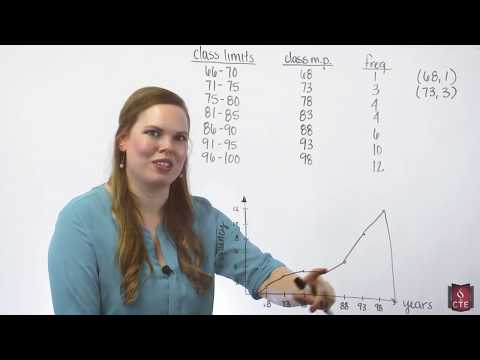
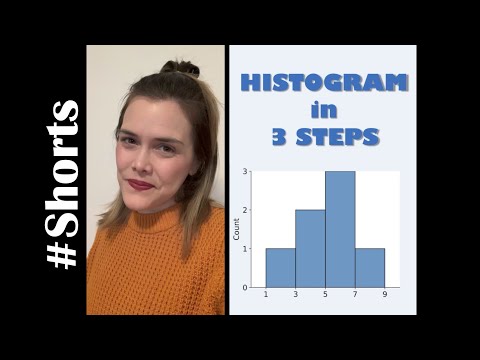
Histogram - (0:43)
Bar graph - (3:14)
Frequency polygon - (5:37)
Stem plot - (6:37)
Ogive - (8:59)
Dot plot - (11:07)
Pie chart - (12:56)
Scatter plot - (13:16)
Guides to choose the graph type - (16:15)
Common mistakes in graphing - (18:32)
#statisticalgraphs #barplotvshistogram #whatisanogive? #scatterplot
Intro - (0:00)
Histogram - (0:43)
Bar graph - (3:14)
Frequency polygon - (5:37)
Stem plot - (6:37)
Ogive - (8:59)
Dot plot - (11:07)
Pie chart - (12:56)
Scatter plot - (13:16)
Guides to choose the graph type - (16:15)
Common mistakes in graphing - (18:32)
#statisticalgraphs #barplotvshistogram #whatisanogive? #scatterplot
 0:20:13
Graphs: histogram, scatter plot, polygon, stemplot, ogive, pie, bar chart, dot plot.
 0:07:09
Science of Data Visualization | Bar, scatter plot, line, histograms, pie, box plots, bubble chart
 0:14:25
Histogram and Frequency Polygon
 0:04:23
Drawing histogram, frequency polygon and ogive using excel
 0:07:35
Bar Charts, Pie Charts, Histograms, Stemplots, Timeplots (1.2)
 0:07:16
Excel Histogram with Normal Distribution Curve
 0:07:21
How to create a histogram | Data and statistics | 6th grade | Khan Academy
 0:12:33
How to Create a Histogram with Normal curve overlay in Excel,Add normal curve, insert bell curve to
 0:06:08
Use Excel 2016 to make Frequency distribution and Histogram for quantitative data
 0:03:27
Constructing a Frequency Polygon
 0:02:28
Median in a histogram | Summarizing quantitative data | AP Statistics | Khan Academy
 0:11:41
How to draw histogram and frequency polygon and also find the mean BCA bcs040 June 2018 solved paper
 0:12:39
Math Antics - Data And Graphs
 0:42:54
Data Presentation; Making Graphs; Histograms, Scattergrams & Pie or Circle Charts
 0:04:05
Creating a Frequency Polygon
 0:01:21
Statistics Class 10 Maths SSC - Frequency Polygon and Frequency Curve: By Histogram
 0:00:55
Histogram in 3 Simple Steps #Shorts
 0:09:24
Make a Histogram in Google Sheets + Frequency Polygon and Ogive
 0:01:57
Creating a histogram and with a frequency polygon in Microsoft Word
 0:27:08
Graphing: Histograms and frequency polygons in EXCEL
 0:02:43
Creating a Histogram & Frequency polygon in Geogebra.
 0:13:00
Methods of Visualizing Data
 0:04:23
GeoGebra: Create a Histogram and Frequency Polygon
 0:08:24
Histogram, Frequency Polygon, and Ogive
Комментарии