filmov
tv
Statics 7.45 - Draw the shear and moment diagrams for the shaft in terms of the parameters shown.

Показать описание
Question: Draw the shear and moment diagrams for the shaft (a) in terms of the parameters shown; (b) set P = 9 kN, a = 2 m, L = 6 m. There is a thrust bearing at A and a journal bearing at B.
Problem 7-45 from :
Engineering Mechanics: Statics, 14th edition
Russell C. Hibbeler
Thank you guys for watching.
Please let me know if you have any comments or suggestions and also if you have any other problem you would like to go over with.
Problem 7-45 from :
Engineering Mechanics: Statics, 14th edition
Russell C. Hibbeler
Thank you guys for watching.
Please let me know if you have any comments or suggestions and also if you have any other problem you would like to go over with.
 0:15:05
Statics 7.45 - Draw the shear and moment diagrams for the shaft in terms of the parameters shown.
 0:16:47
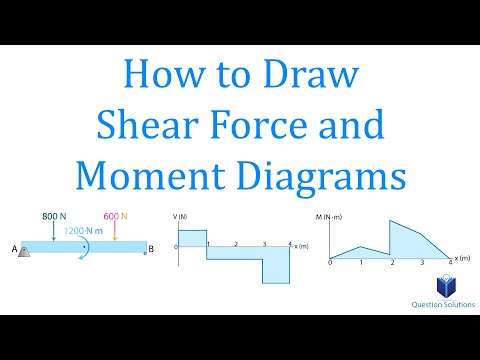
How to Draw Shear Force and Moment Diagrams | Mechanics Statics | (Step by step solved examples)
 0:15:30
Statics 7.61 - Draw the shear and moment diagrams for the beam.
 0:14:34
Mean, Median, and Mode of Grouped Data & Frequency Distribution Tables Statistics
 0:01:55
Percentiles (1.7)
 0:01:12
Percentage v/s Percentile? | Fun Math | Don't Memorise
 0:05:09
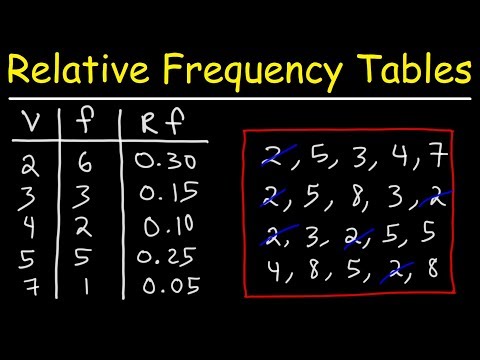
How To Make a Relative Frequency Distribution Table
 0:07:47
Stem and Leaf Plots
 0:07:21
How to create a histogram | Data and statistics | 6th grade | Khan Academy
 0:06:36
Graphs for Kids | Learn all about basic graphs
 0:13:34
Hypothesis Testing Problems - Z Test & T Statistics - One & Two Tailed Tests 2
 0:01:28
Mickey Mouse Clubhouse | Basement Slide ✨ | @disneyjr
 0:02:28
Median in a histogram | Summarizing quantitative data | AP Statistics | Khan Academy
 0:05:10
Example: Lottery probability | Probability and combinatorics | Precalculus | Khan Academy
 0:13:56
How To Make Box and Whisker Plots
 0:11:23
The Shape of Data: Distributions: Crash Course Statistics #7
 0:11:06
Sampling Distributions (7.2)
 0:17:15
How to draw and interpret Stem and Leaf diagrams #stemandleafdiagrams #stemandleaf #statistics
 0:06:00
Test Statistic For Means and Population Proportions
 0:24:47
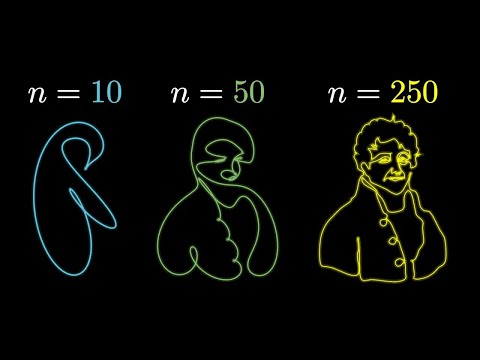
But what is a Fourier series? From heat flow to drawing with circles | DE4
 0:33:20
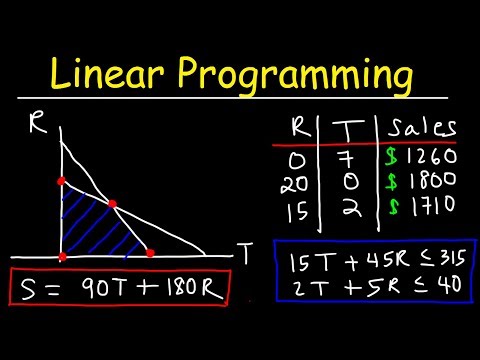
Linear Programming
 0:07:35
LANDFORMS | Types Of Landforms | Landforms Of The Earth | The Dr Binocs Show | Peekaboo Kidz
 0:06:11
IX Statistics Draw the frequency polygon representing the following frequency distribution Class in
 0:11:49
Intersection of Sets, Union of Sets and Venn Diagrams
Комментарии