filmov
tv
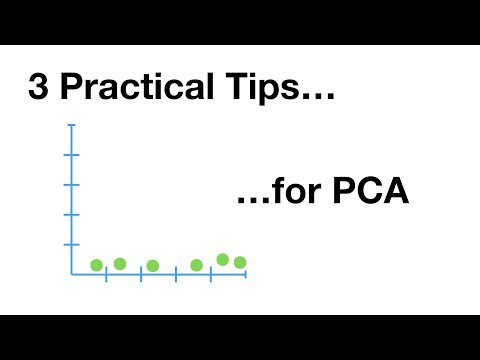
StatQuest: PCA - Practical Tips

Показать описание
In it, I give practical advice about the need to scale your data, the need to center your data, and how many principal components you should expect to get.
For a complete index of all the StatQuest videos, check out:
If you'd like to support StatQuest, please consider...
...or...
...buying one of my books, a study guide, a t-shirt or hoodie, or a song from the StatQuest store...
...or just donating to StatQuest!
Lastly, if you want to keep up with me as I research and create new StatQuests, follow me on twitter:
0:00 Awesome song and introduction
0:47 Make sure the data are on the same scale
2:53 Make sure the data are centered
3:30 How to determine the number of principal components
#statquest #PCA #ML
 0:08:20
StatQuest: PCA - Practical Tips
 0:06:05
StatQuest: PCA main ideas in only 5 minutes!!!
 0:21:58
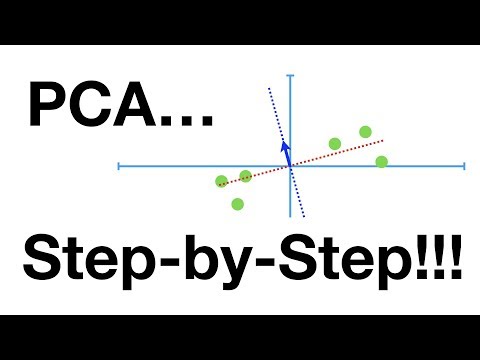
StatQuest: Principal Component Analysis (PCA), Step-by-Step
 0:08:57
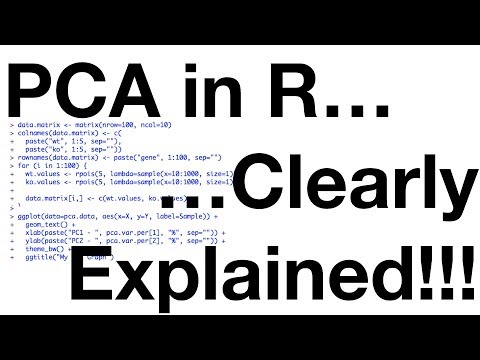
StatQuest: PCA in R
 0:11:37
StatQuest: PCA in Python
 0:10:56
Principal Component Analysis (PCA) - easy and practical explanation
 0:06:28
Principal Component Analysis (PCA)
 0:00:36
Josh Starmer - On how to make technical learning more fun #shorts
 0:15:39
PCA: key steps in practice
 0:00:48
Andrew Ng's Secret to Mastering Machine Learning - Part 1 #shorts
 0:03:05
5) PCA summary
 0:03:37
Genomics exercise part 1 of 2 | PCA | Practical genomics
 0:07:23
Transform Your Analysis: Dive into PCA Compression for Data
 0:08:18
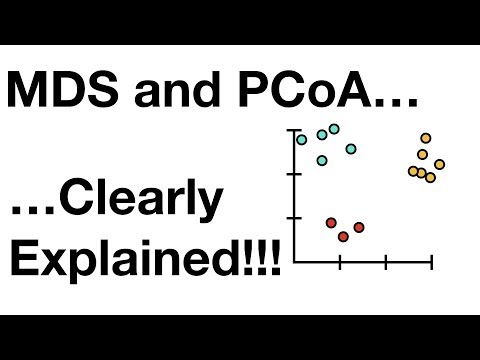
StatQuest: MDS and PCoA
 0:05:07
Principal Component Analysis Easy Tutorial #1
 0:09:36
Principal Component Analysis (PCA): With Practical Example in Minitab
 0:01:52
PCA 18: When principal components fail
 1:17:12
19. Principal Component Analysis
 0:02:19
Support Vector Machine (SVM) in 2 minutes
 0:12:15
Contrastive PCA: Applications & Results
 0:02:08
PCA Advice
 0:11:48
StatQuest: t-SNE, Clearly Explained
 0:12:36
BroadE: Hail - Practical 3: Principal Component Analysis (PCA) and Deciphering Ancestry
 0:20:22
PCA : the math - step-by-step with a simple example
Комментарии