filmov
tv
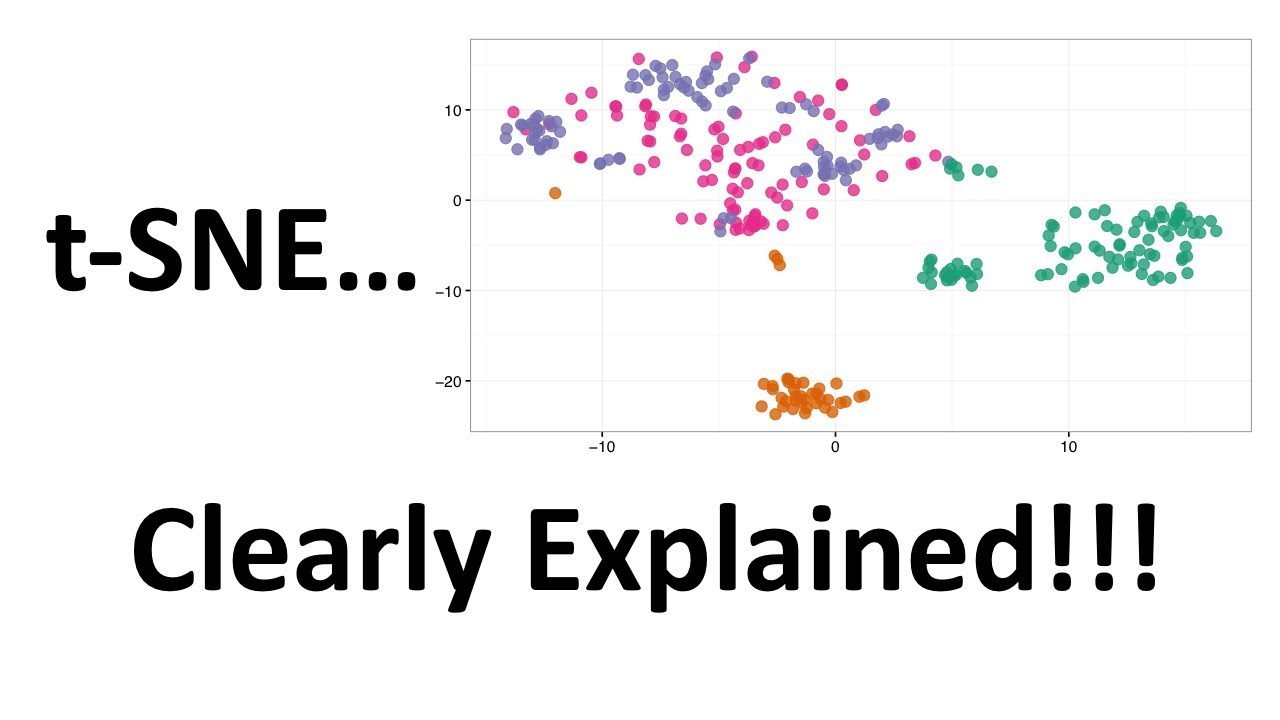
StatQuest: t-SNE, Clearly Explained
Показать описание
t-SNE is a popular method for making an easy to read graph from a complex dataset, but not many people know how it works. Here's the inside scoop.
Here’s how to create a t-SNE graph in R (this is copied from the help file for Rtsne)…
library("Rtsne")
iris_unique <- unique(iris) # Remove duplicates
tsne_out <- Rtsne(iris_matrix) # Run TSNE
# Show the objects in the 2D tsne representation
plot(tsne_out$Y,col=iris_unique$Species)
For a complete index of all the StatQuest videos, check out:
If you'd like to support StatQuest, please consider...
Buying The StatQuest Illustrated Guide to Machine Learning!!!
...or...
...a cool StatQuest t-shirt or sweatshirt:
...buying one or two of my songs (or go large and get a whole album!)
...or just donating to StatQuest!
Lastly, if you want to keep up with me as I research and create new StatQuests, follow me on twitter:
0:00 Awesome song and introduction
1:19 Overview of what t-SNE does
2:24 Overview of how t-SNE works
4:12 Step 1: Determine high-dimensional similarities
9:26 Step 2: Determine low-dimensional similarities
10:33 Step 3: Move points in low-d
11:05 Why the t-distribution is used instead of the normal distribution
Corrections:
6:17 I should have said that the blue points have twice the density of the purple points.
7:08 There should be a 0.05 in the denominator, not a 0.5.
#statquest #tsne
 0:11:48
StatQuest: t-SNE, Clearly Explained
 0:00:48
tSNE
 0:25:49
t-SNE Simply Explained
 0:06:05
StatQuest: PCA main ideas in only 5 minutes!!!
 0:18:52
UMAP Dimension Reduction, Main Ideas!!!
 0:09:30
Clustering with DBSCAN, Clearly Explained!!!
 0:03:27
Python Tutorial: t-SNE visualization of high-dimensional data
 0:05:06
t-Distributed Stochastic Neighbor Embedding
 0:02:46
What is t-Distributed Stochastic Neighbor Embedding (t-SNE) in Machine Learning?
 0:14:33
5_4_3_5_1 dimensionality reduction methods t Distributed Stochastic Neighbor Embedding t SNE
 0:08:43
TSNE - best dimensationality reduction technique ???
 0:33:02
PyData Tel Aviv Meetup: Visualizing High Dimensional Data (t-SNE) - Gal Yona
 0:00:19
T-SNE visualisation of novel diabetes subgroups in CNDMDS cohort: video 1 of 5
 0:05:54
tSNE vs MDS vs PCA
 0:00:11
Using t-SNE for dimensionality reduction of optdigits dataset
 0:14:35
Why T-distributed Stochastic Neighbor Embedding (TSNE) is great for visualization? Math Step By Step
 0:06:26
What is t-SNE(T-distributed Stochastic Neighborhood Embedding) Lecture 21@Applied AI Course
 0:00:53
t-SNE Explanation With Visual Demo
 0:16:02
UMAP: Mathematical Details (clearly explained!!!)
 0:01:02
tSNE Animation
 0:57:52
BioTuring Webinar | Using t SNE for Data Analysis: A Quick Introduction | Laurens van der Maaten
 0:20:43
t-SNE: Clearly Explained
 0:21:58
StatQuest: Principal Component Analysis (PCA), Step-by-Step
 0:20:42
Machine Learning | t-SNE
Комментарии