filmov
tv
InfluxDB 2.1, Grafana and Telegraf install

Показать описание
This is my second video on setting up my new home automation server, and I am still installing components, this time InfluxDB 2.1, Grafana and Telegraf. I wanted to talk about it, because there are a few curve balls when it comes to using InfluxDB 2.x.
Everything I talk about in this video is documented here:
Chapters:
0:00 Intro
2:01 Why not Docker?
3:13 Installing InfluxDB 2.x
5:27 Influx 1.x vs 2.x in high level
9:50 Installing Telegraf
15:40 Installing Grafana
18:00 Flux connection in Grafana
20:33 InfluxQL connection in Grafana
26:30 Adding Telegraf dashboard in Grafana
28:16 Closing comments
 0:29:36
InfluxDB 2.1, Grafana and Telegraf install
 0:11:17
Grafana 8 InfluxDB 2 and Telegraf | Create First Grafana Dashboard
 0:13:43
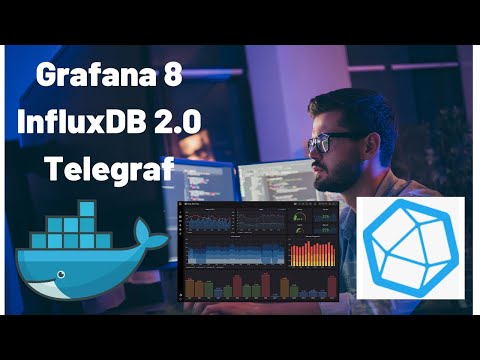
Easily Install InfluxDB, Telegraf, & Grafana with Docker
 0:01:47
How Telegraf Works for Data Collection
 0:22:44
How To Setup Influxdb Telegraf And Grafana | Telegraf Influxdb Grafana Tutorial
 0:38:10
Infrastructure Monitoring Basics with Telegraf, Grafana and InfluxDB - Jay Clifford, InfluxData
 0:20:37
Telegraf - Ein Datensammler für alles (2020) - InfluxDB #DataCollect #Metrics #Grafana
 0:25:28
Homelab Monitoring Made Easy - Part 1: Tools Overview - Grafana, Prometheus, InfluxDB, Telegraf
 0:03:46
Using the Telegraf Modbus Plugin with Influx
 0:17:15
Installing InfluxDB, Telegraf and Grafana Dashboards
 0:03:13
Linking Grafana to InfluxDB V2.0
 0:22:41
How To Setup Influxdb Telegraf And Grafana Using Docker Compose | Telegraf Influxdb Grafana Tutorial
 0:11:59
Part 4 - Tutorial 3: Collecting Metrics with Telegraf | The Complete Guide to InfluxDB 2
 0:14:50
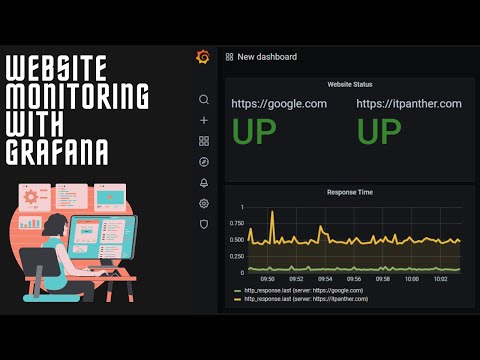
Monitor Websites With #Grafana InfluxDb and Telegraf - Synthetic Monitoring Using Grafana & Tele...
 0:44:38
InfluxDB 2.x - Alle Grundlagen für Einsteiger
 0:09:36
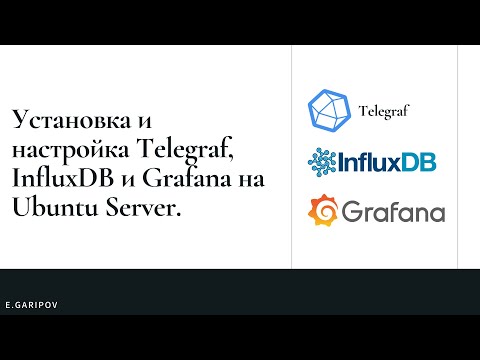
Установка и настройка / Installing and configuring - Telegraf, InfluxDB и Grafana...
 0:12:31
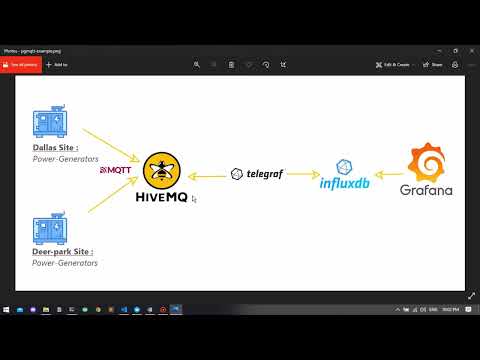
Cisco Model-Driven Telemetry tutorial with Telegraf, InfluxDB, and Grafana!
 0:17:49
InfluxDB 2.0 - Complete Guide to Getting Started with InfluxDB 2
 0:10:39
Create a SLICK Dashboard for your homelab using Grafana, Telegraf and InfluxDB.
 0:04:43
InfluxDB: Intro to Telegraf
 1:15:02
Shelly Full Guide mit InfluxDB und MQTT sowie Telegraf in Grafana visualisieren (Überlange!!!)
 0:19:46
My new Proxmox Monitoring Tools: InfluxDB2 + Grafana
 0:20:21
SmartHome Zentrale mit ioBroker Teil 3 - Docker, Portainer, InfluxDB, Grafana und Telegraf
 0:03:11
Simple IoT project with influxDb, Grafana and Telegraf using MQTT
Комментарии