filmov
tv
Mean Median and Mode: Understanding and Calculating Measures of Central Tendency
Показать описание
Connect with me on
Measures of central tendency include descriptive statistics including the mean, median and mode that are used to describe what the average person or response in a particular study is like. It is important as a research consumer to understand how these statistics are calculated and used to summarize and organize information in a study.
Before talking about these measures of central tendency, it is important to know what a normal distribution is. The best measure of central tendency depends on a number of things including weather data has a normal distribution or not. The theoretical concept of a normal distribution is covered in more depth in another video, but simply put it is the idea that when data are gathered from interval or ratio level measures and plotted on a graph it will resemble a normal curve.
The three measures of central tendency described in this video would all fall at the same midline point on a normal distribution curve. However, if data are not normally distributed certain measures may be better than others. The appropriateness of each measure is also influenced by the level of measurement used in the study.
Throughout this video I will have examples of how to calculate the mean, median and mode on the screen. These examples will use the data I made up for a fake study about hours students spend watching online videos and reading for studying purposes.
In statistics, mean is synonymous with the average. Whether it is true or not you could try remembering that the average girl can be mean when they want to be.
Or, if you can remember what the other two are so you can figure this one out through the process of elimination.
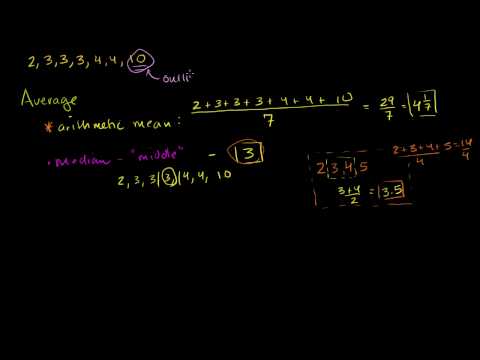
You may remember how to calculate averages from math class. To calculate the mean or average of a group of numbers, first add all the numbers. Then, divide by the number of values.
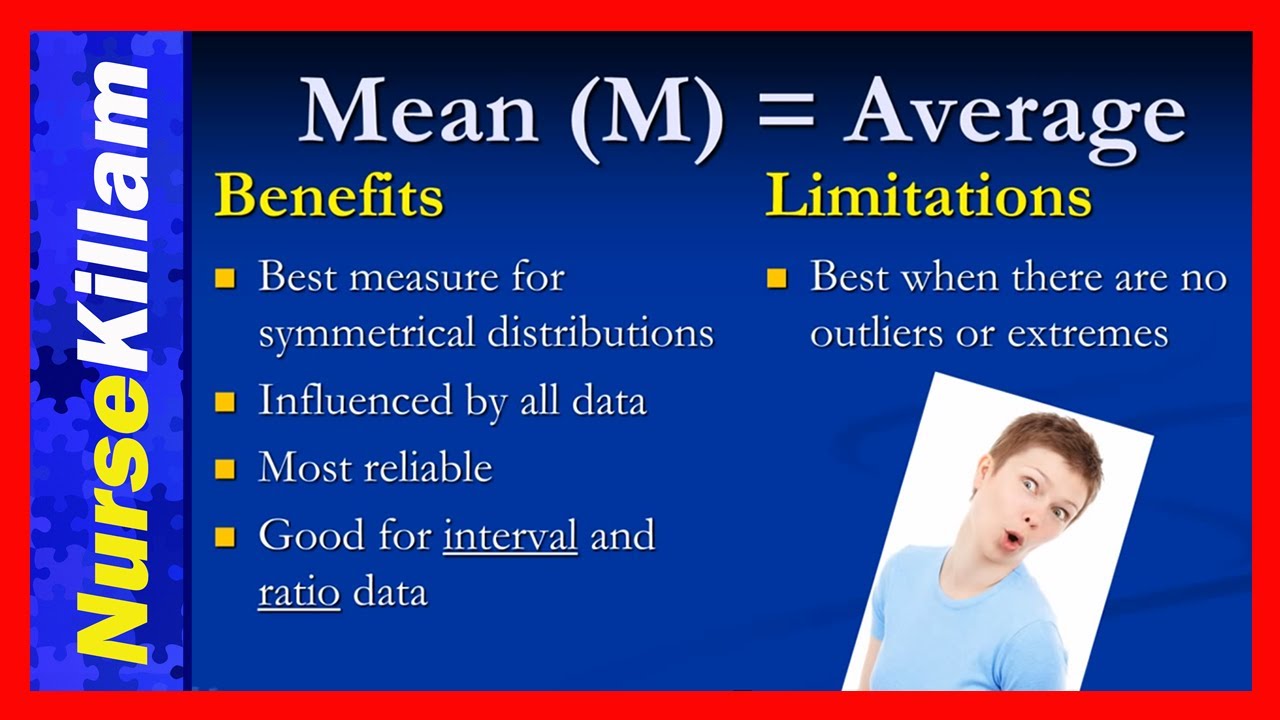
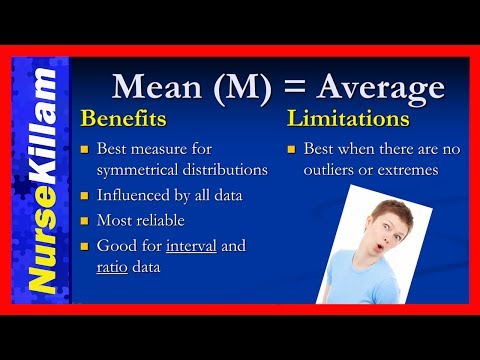
The mean or average is the most common, best known and most widely used measure to describe the center of a frequency distribution. The mean is influenced by all data in a Study. For this reason, it works best for symmetrical distributions of data where there are no outliers or extremes. However, the larger the data set the smaller the influence of any extreme scores will be. The mean is the most commonly use measure because it is considered the most reliable measure of central tendency when making inferences from a sample population. However, it is only appropriate for interval and ratio level data.
The Median is the value in the middle of a set of data. One way to remember that median means middle is to try associating it with the word medium. Median and medium sound sort of similar. They also both start with the letters MED. A medium pizza or a medium coffee is typically the size in the middle range at a store.
If there is an even number of values simply divide the two numbers in the middle by 2.
Unlike the Mean, the mode is not influenced by extreme values in a data set. Therefore, it is a good measure to use when distributions are not symmetrical. If a researcher is working with data that are not normally distributed and wants to know what the typical score is the median is likely the best measure to use. In this situation both the mean and median would likely be reported. The median is limited because it is not algebraically defined. Instead it is simply the point in the middle of the data set. While it is useful for ordinal, interval and ratio levels of measurement it cannot be used for nominal data.
The Mode is the most frequent value, number or category in a set of data. One way to remember this definition is that Mode sounds like Most. Both mode and most start with the letters MO.
The mode is the only measure of central tendency you can use for nominal data. While it can be used for all levels of measurement, it is considered unstable since fluctuations are likely between sample populations. Sometimes there is no mode. If all scores are different the mode does not exist. Sometimes there are multiple modes. If several values occur with equal frequency there are several modes. Unfortunately the mode can't be used for any further calculations in the study -- it can only help to describe the central tendency of the population.
 0:11:04
Math Antics - Mean, Median and Mode
 0:02:23
Mean, Median, and Mode
 0:05:41
Mean, Median, Mode, and Range | Math with Mr. J
 0:03:55
Finding mean, median, and mode | Descriptive statistics | Probability and Statistics | Khan Academy
 0:03:47
The Mean, Median and Mode Toads
 0:07:10
Mode, Median, Mean, Range, and Standard Deviation (1.3)
 0:11:38
Mean, Median, Mode, and Range - How To Find It!
 0:04:03
Mean Median Mode and Range Explained (Updated 4K version)
 0:35:40
Introduction to Python Libraries for Data Science | AIML End-to-End Session 52
 0:14:34
Mean, Median, and Mode of Grouped Data & Frequency Distribution Tables Statistics
 0:00:23
Mean median mode range
 0:06:19
Mean Median and Mode: Understanding and Calculating Measures of Central Tendency
 0:12:42
The Maths Prof: Frequency Tables (Mean, Median, Mode & Range)
 0:12:56
Mean, Median, Mode, and Outliers: Measures of Central Tendency
 0:06:31
Finding Mean, Median, and Mode | Math with Mr. J
 0:09:01
Average or Central Tendency: Arithmetic Mean, Median, and Mode
 0:03:41
An Average Video | Mean, Median, Mode, and Range
 0:08:24
STATISTICS- Mean, Median And Mode Explained Easily
 0:07:41
Mean, Median, Mode with Real Life examples | Machine Learning
 0:13:25
Descriptive Statistics: FULL Tutorial - Mean, Median, Mode, Variance & SD (With Examples)
 0:04:45
Statistics Grade 10: Mean, mode, median
 0:31:53
Calculate & Understand the Mean, Median & Mode of Data - [7-6-11]
 0:11:23
Mean, Median, and Mode: Measures of Central Tendency: Crash Course Statistics #3
 0:06:48
Introduction to Statistics and Basics of Mean, Median & Mode
Комментарии