filmov
tv
Mean, Median, Mode with Real Life examples | Machine Learning

Показать описание
00:00 – Intro
00:55 – Mean
04:13 – Median
06:02 – Mode
07:08 - Range
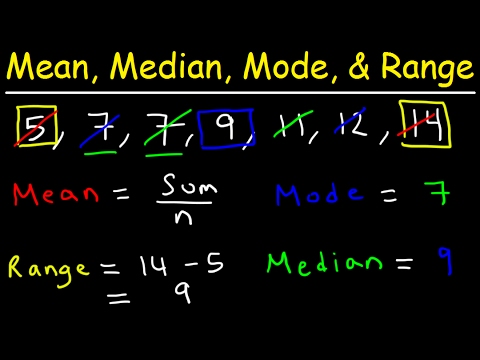
Mean is the most commonly used measure of central tendency. It actually represents the average of the given collection of data.
Generally median represents the mid-value of the given set of data when arranged in a particular order
The most frequent number occurring in the data set is known as the mode.
Thus, the range could also be defined as the difference between the highest observation and lowest observation. The obtained result is called the range of observation. The range in statistics represents the spread of observations.
Other subject playlist Link:
--------------------------------------------------------------------------------------------------------------------------------------
►Theory of Computation
►Operating System:
►Database Management System:
►Computer Networks:
►Artificial Intelligence:
►Computer Architecture:
►Design and Analysis of algorithms (DAA):
►Structured Query Language (SQL):
---------------------------------------------------------------------------------------------------------------------------------------
Our Social Media:
--------------------------------------------------------------------------------------------------------------------------------------
►A small donation would help us continue making GREAT Lectures for you.
►For any other Contribution like notes pdfs, feedback, suggestion etc
►For Bussiness Query
00:55 – Mean
04:13 – Median
06:02 – Mode
07:08 - Range
Mean is the most commonly used measure of central tendency. It actually represents the average of the given collection of data.
Generally median represents the mid-value of the given set of data when arranged in a particular order
The most frequent number occurring in the data set is known as the mode.
Thus, the range could also be defined as the difference between the highest observation and lowest observation. The obtained result is called the range of observation. The range in statistics represents the spread of observations.
Other subject playlist Link:
--------------------------------------------------------------------------------------------------------------------------------------
►Theory of Computation
►Operating System:
►Database Management System:
►Computer Networks:
►Artificial Intelligence:
►Computer Architecture:
►Design and Analysis of algorithms (DAA):
►Structured Query Language (SQL):
---------------------------------------------------------------------------------------------------------------------------------------
Our Social Media:
--------------------------------------------------------------------------------------------------------------------------------------
►A small donation would help us continue making GREAT Lectures for you.
►For any other Contribution like notes pdfs, feedback, suggestion etc
►For Bussiness Query
 0:11:04
Math Antics - Mean, Median and Mode
 0:03:47
The Mean, Median and Mode Toads
 0:02:23
Mean, Median, and Mode
 0:05:49
Mean, Median, Mode with Real life Scenario!
 0:02:28
Why We Use Mean, Median and Mode | The Statisticians
 0:00:23
Mean median mode range
 0:07:41
Mean, Median, Mode with Real Life examples | Machine Learning
 0:05:41
Mean, Median, Mode, and Range | Math with Mr. J
 2:12:14
TEAS 7 Math - ALL IN ONE Webinar - Measurement and Data - October 2024
 0:11:38
Mean, Median, Mode, and Range - How To Find It!
 0:03:25
MEAN,MODE and MEDIAN
 0:03:50
Mean Vs Median. When to use which one.
 0:03:55
Finding mean, median, and mode | Descriptive statistics | Probability and Statistics | Khan Academy
 0:14:34
Mean, Median, and Mode of Grouped Data & Frequency Distribution Tables Statistics
 0:07:10
Mode, Median, Mean, Range, and Standard Deviation (1.3)
 0:04:03
Mean Median Mode and Range Explained (Updated 4K version)
 0:00:45
SPSS - Mean, Median, Mode, Standard Deviation & Range
 0:00:43
Mean Median Mode EXPLAINED | SAT & ACT Math Prep | Daily Math
 0:07:08
Measure of Central Tendency - What? Why? How? || Mean || Median || Mode || Statistics for Beginners
 0:00:44
Mean,Median,Mod And Range👍🏻 #MATHSFUN#shorts #viral
 0:06:31
Finding Mean, Median, and Mode | Math with Mr. J
 0:08:53
Use of Median in Real life. When to use Median and not mean?
 0:03:41
An Average Video | Mean, Median, Mode, and Range
 0:07:06
Mean, median, and mode - comparisons, Elementary Statistics in ALEKS
Комментарии