filmov
tv
Constructing a Frequency Histogram (Absolute and Relative Frequency)

Показать описание
Follow us:
A frequency histogram is a bar chart showing the frequency of occurrence of each class. The width of each bar is equal to the class width, and the height of each bar is equal to the frequency.
The horizontal axis can show the class limits, the class midpoints, or both. The vertical axis can show the absolute frequency, the relative frequency, or both.
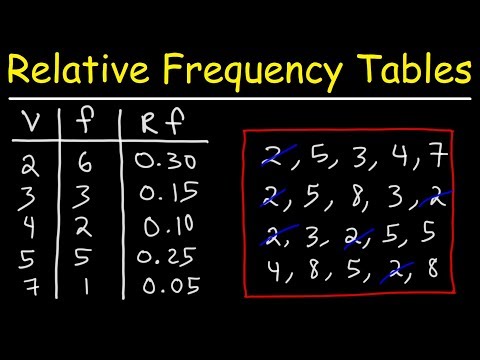
Q. Using the table provided below:
Make and graph a frequency histogram.
 0:05:00
 0:11:16
 0:06:08
 0:14:17
 0:07:55
 0:06:32
 0:07:21
 0:12:51
 0:11:05
 0:05:09
 0:08:51
 0:05:02
 0:02:10
 0:08:28
 0:24:25
 0:04:29
 0:06:48
 0:09:45
 0:25:11
 0:03:20
 0:01:01
 0:05:04
 0:12:16
 0:03:47