filmov
tv
Creating Histograms in SPSS
Показать описание
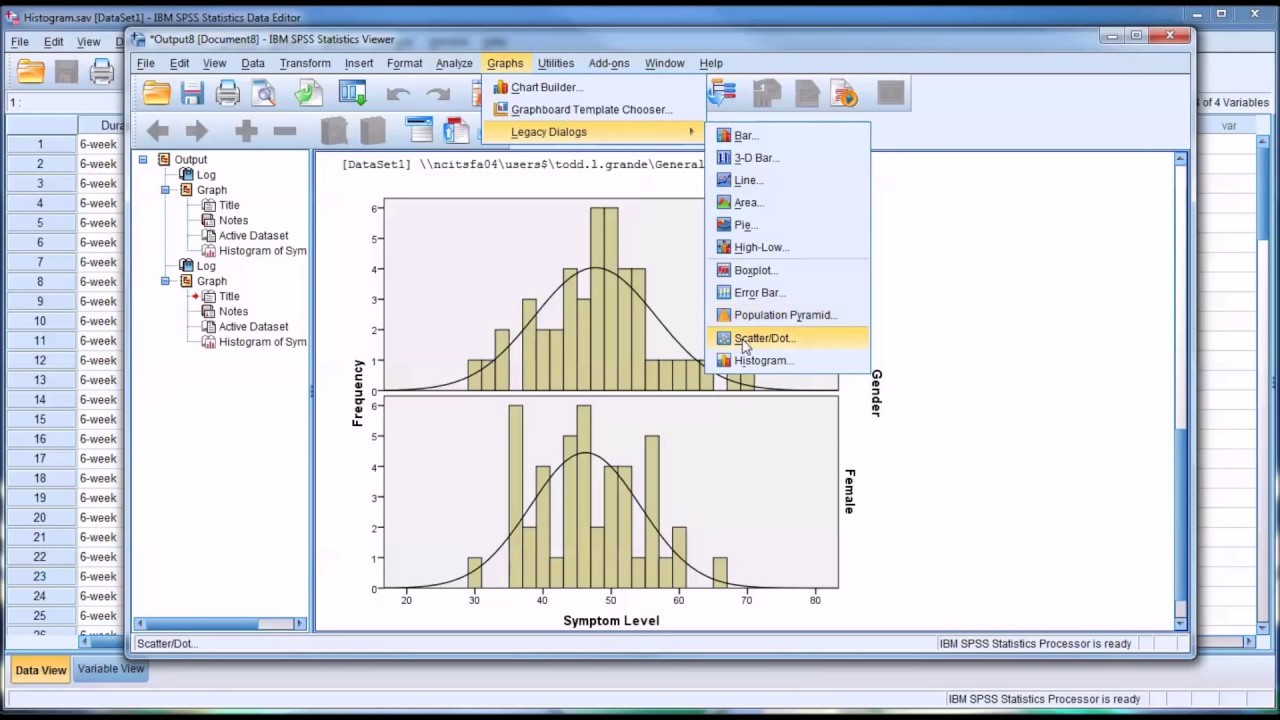
This video demonstrates how to create histograms using Legacy Dialogs in SPSS. Multiple rows and columns containing levels of independent variables are used to graph a dependent variable.
 0:09:45
Creating Histograms in SPSS
 0:05:14
Create a Histogram in SPSS
 0:09:22
Creating Histogram with classes in IBM SPSS.
 0:01:29
Creating Histograms on SPSS
 0:03:52
creating histograms in SPSS
 0:02:34
Creating Histograms Using SPSS Graphs
 0:08:44
SPSSisFun: Creating Histograms using the Chart Builder function
 0:02:07
IBM SPSS Statistics 20: Histograms
 0:02:10
Histograms Using SPSS
 0:03:26
SPSS Explore Data / How to Create a Panel of Histograms
 0:03:57
SPSS demo: Histograms
 0:00:51
SPSS Histogram with Normal Curve - Easy tutorial by StatisticalGP
 0:08:26
SPSS Explore Data / How to Create a Histogram for a Numeric Variable (Simple and Binned)
 0:02:53
Histograms in SPSS
 0:01:05
SPSS: Histograms
 0:03:16
Rakita: Creating Histograms in SPSS
 0:11:01
Introduction to SPSS (v20) - Histograms
 0:01:47
Histograms in SPSS
 0:06:13
Histograms in SPSS
 0:08:11
Overlapping Histograms - SPSS
 0:11:37
MASTERING SPSS - DATA VISUALIZATION WITH SPSS | BAR CHART, PIE CHART, HISTOGRAM, BOXPLOT, ETC
 0:12:07
Pie Charts, Bar Graphs and Histograms in SPSS
 0:04:31
SPSS Explore Data / How to Create a Clustered Bar Chart for Many Categorical Variables
 0:13:15
SPSS Basics Chapter 4 Histograms
Комментарии